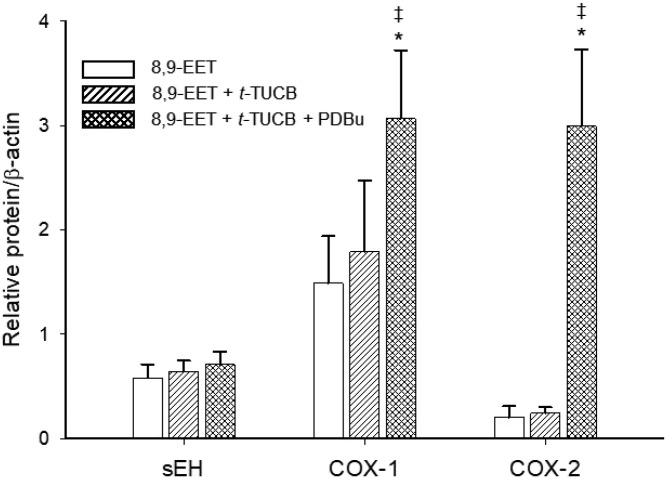
Fig. 4.
COX-1 and sEH are expressed in basal HAECs, and COX-2 expression is induced by PDBu. Western blot analysis of sEH, COX-1, and COX-2 in HAEC cell extracts. 8,9-EET (1 µM) was incubated with HAEC cells (300,000) with full media (3 ml) with and without the sEH inhibitor t-TUCB and COX-2 inducer PDBu for 24 h. The graph shows quantification of Western blot bands, where protein responses were normalized with respect to β-actin. Equal amounts of protein from the vehicle and treatment groups were analyzed in triplicate. *P < 0.05 versus the COX-2 expression in the vehicle and t-TUCB groups; ‡P < 0.05 versus sEH expression (all treatments). Statistical tests were performed using one-way ANOVA with Holm-Sidak pairwise analysis. The raw data used for this figure is reported in supplemental Table S3.

