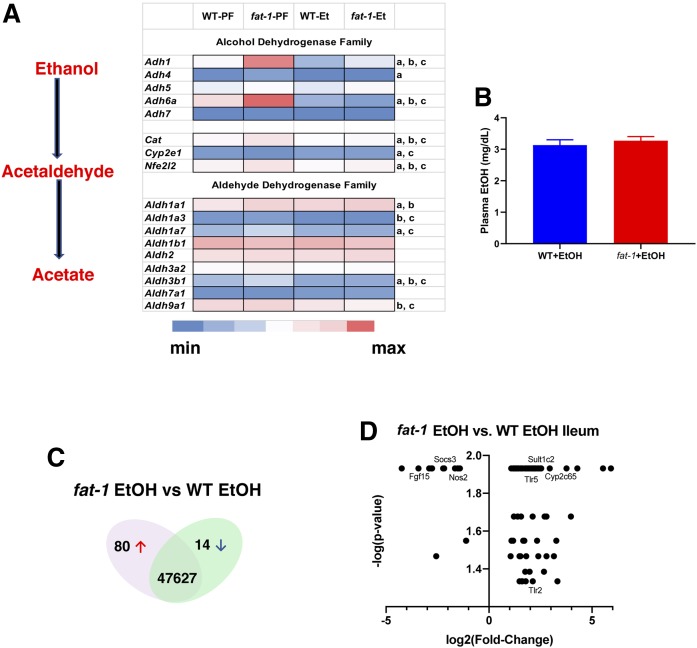
Fig. 2.
Differential gene expression in WT versus fat-1 mice. A: Effects of modulation of the ω-6:ω-3 PUFA ratio on EtOH-metabolizing enzymes in the intestine. Data are presented as gene expression levels of the corresponding group. Lowercase letters indicate statistically significant changes between groups (a: fat-1-PF vs. WT-PF; b: WT-PF vs. WT-EtOH; c: fat-1-PF vs. fat-1-EtOH; P < 0.05). B: Plasma EtOH levels (n = 6–10). Venn diagram (C) and graphical representation (D) of total number of genes differentially expressed in the EtOH groups.

