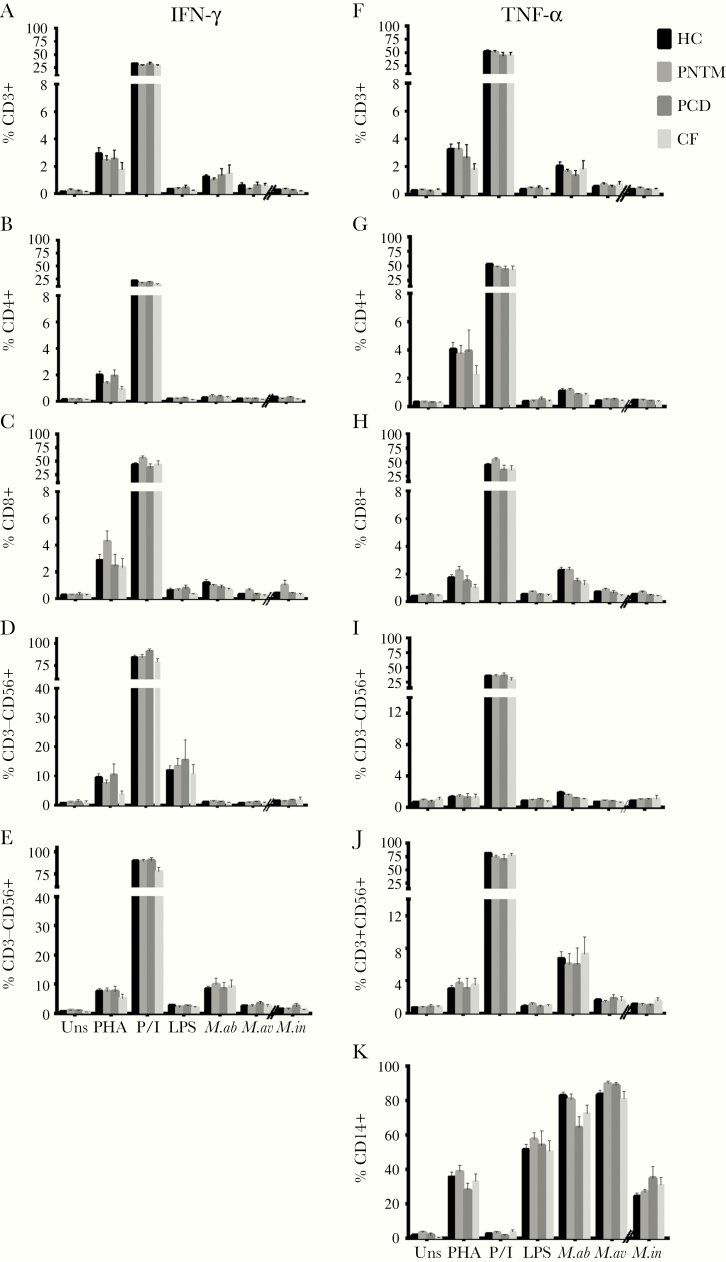
Fig 1.
Flow cytometric analyses showing the mean percentages of IFN-γ (A-F) and TNF-α (G-L) expressed by different leukocyte subpopulations after stimulation with various mitogens and agonists, as indicated. No significant differences were found in the percentages of CD3+ T cells, CD4+ T cells, CD8+ T cells, CD3-CD56+ NK cells, and CD3+CD56+ NK T cells that expressed IFN-γ and TNF-α (A–E, F–J), and in the percentage of TNF-α –expressing CD14+ cells (K) between healthy controls and patients with idiopathic pulmonary nontuberculous mycobacterial (PNTM) disease, primary ciliary dyskinesia (PCD), and cystic fibrosis (CF). HC indicates healthy controls; uns, unstimulated; PHA, phytohemagglutinin + IL-12; P/I, phorbol 12-myristate 13-acetate + ionomycin; M.ab, Mycobacterium abscessus (MOI: 10:1); M.av, Mycobacterium avium (MOI: 10:1); M.in; Mycobacterium intracellulare (MOI: 0.2:1). Data are presented as means; error bars show standard error.

