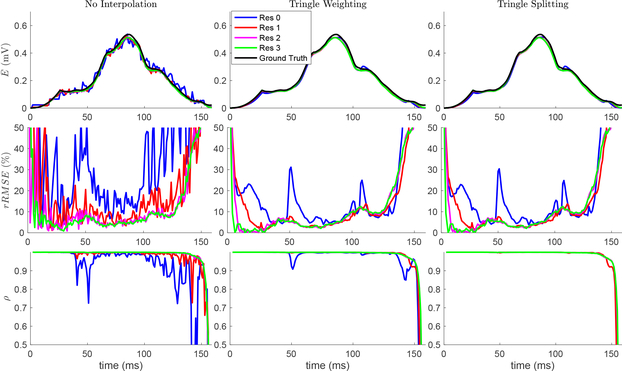
Fig. 3.
Effect of spatial resolution and interpolation on all body surface potentials. Three cardiac surface resolutions are shown in each plot, and the ground truth is shown in the Ē plots. The three rows represent a metric (Ē, rRMSE and ρ). Columns represent interpolation method. The plot of the temporal metrics of Res 4 were nearly indistiguishable from Res 3.

