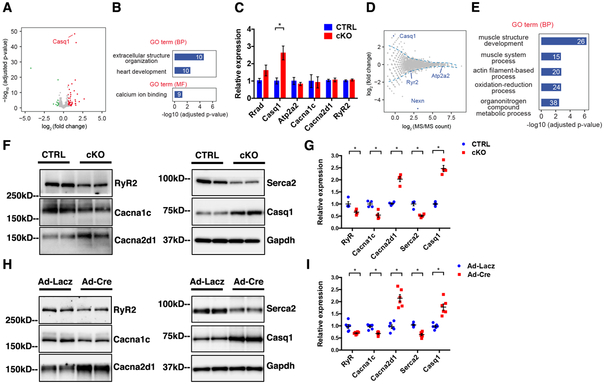
Figure 3. Abnormal expression of Ca2+-handling genes in NEXN cKO heart.
(A) Volcano plot of gene expression changes between CTRL and NEXN cKO P1 ventricles (n = 3). Genes with adjusted P value < 0.05 and fold change > 1.5 or < 2/3 are considered as significantly up- or down-regulated genes, and highlighted in red and green, respectively. (B) GO enrichment analysis of differentially expressed genes by RNAs-seq. Number of genes belonging to each category is indicated. BP: biological process, MF: molecular function. (C) qPCR analysis of Ca2+-handling genes from E18.5 mouse ventricles (n = 4). (D) MA plot showing the fold change of protein abundance against average MS/MS count assayed by mass spectrometry from P1 mouse ventricles (n = 4). Blue dotted line: fold-change cutoff selecting differentially expressed proteins. (E) GO enrichment analysis of differentially expressed proteins by mass spectrometry. (F-H) Western blot representative images and (G-I) quantification graphs of Ca2+-handling proteins from (F-G) E18.5 mouse ventricles (n = 4) and from (H-I) isolated neonatal NEXNf/f cardiomyocytes treated with Ad-Lacz or Ad-cre virus (n=6). (*) Statistically significant differences with P value < 0.05.

