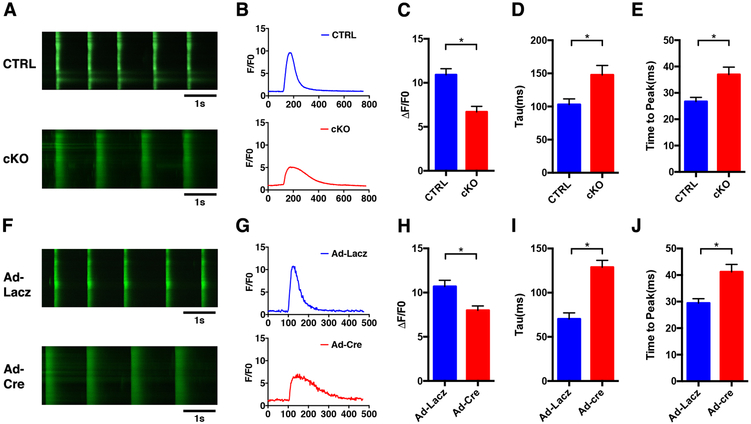
Figure 4. Alteration of Ca2+ dynamics in NEXN cKO cardiomyocytes.
(A) Representative time-lapse confocal images (scale bars 1 sec), Ca2+ transients measuraments were performed at a pace of 0.5Hz; (B) representative Ca2+ transient curve; and (C-E) histograms showing results from quantifications of Ca2+ transient (C) amplitude (ΔF/F0) (D)transient decay (Tau) and (E) time to peak of live cardiomyocytes isolated from E18.5 CTRL and cKO ventricles were labeled with Fluo4 (n=6 mice). (F) Representative time-lapse confocal images (scale bars 1 sec); (G) representative Ca2+ transient curve and (G-J) histograms showing results from quantification of Ca2+ transient (H) ΔF/F0 and (I) Tau and (J) time to peak of E18.5 isolated neonatal cardiomyocytes Nexnf/f treated with Ad-Lacz and Ad-cre virus labeled with Fluo4 (n=6 mice). (*) Statistically significant differences with P value < 0.05.

