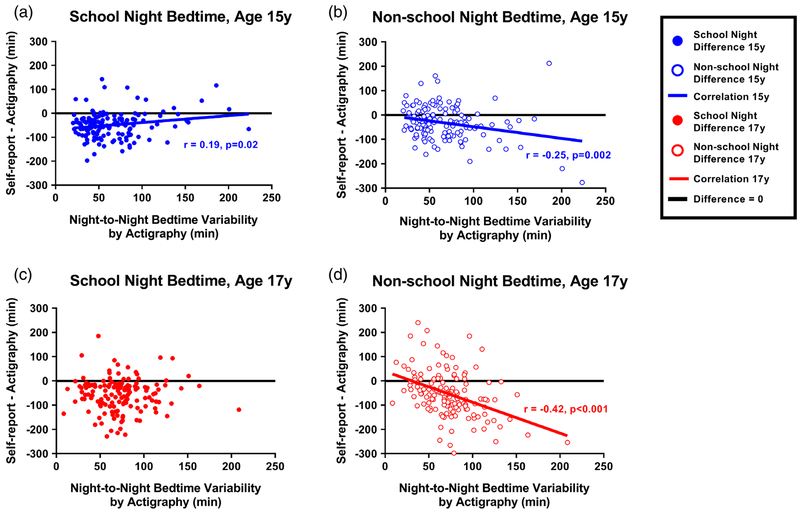
Figure 2 —
The difference between self-reported and average actigraphy-measured bedtimes versus night-to-night variability of actigraphy-measured bedtimes for 144 students. Plots are shown for: a. School nights at age 15 y (filled blue circles), b. Non-school nights at age 15 y (open blue circles), c. School-nights at age 17 y (filled red circles), d. Non-school nights at age 17 y (open red circles). There was a significant positive correlation on school nights at 15 y and significant negative correlations on non-school nights at both ages.

