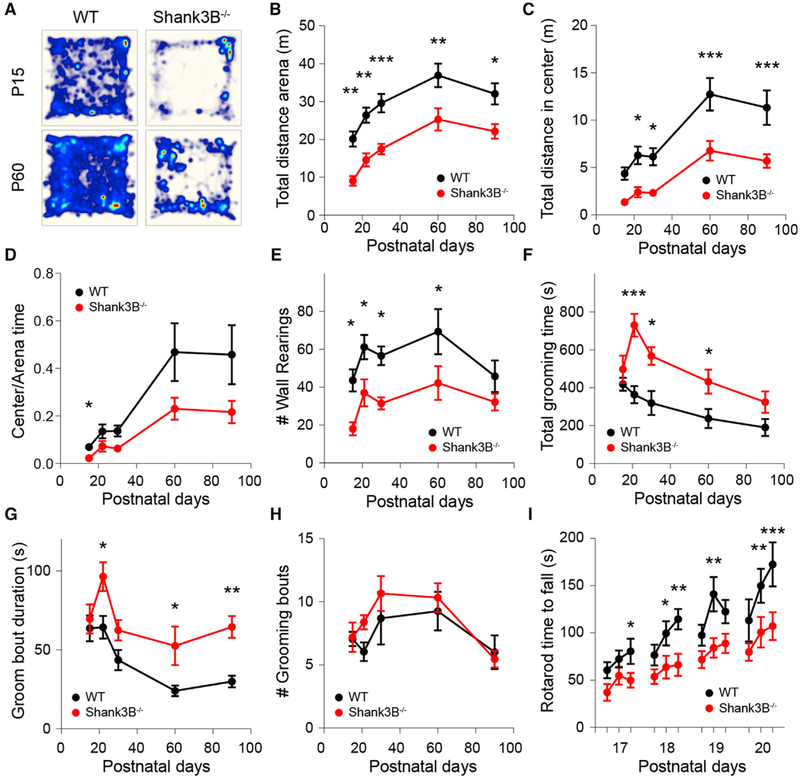
Figure 1. Early Onset of Behavioral Deficits in Shank3B−/− Mice.
(A) Total distance traveled for 30 min in the open field test by P21 and P60 WT and Shank3B−/− mice. Heatmap represents distance values normalized to P60 WT.
(B and C) Mean ± SEM of distance traveled by P15–P90 WT and Shank3B−/− mice during 30 min (B) in the open field arena or (C) in the center region of the arena.
(D) Mean ± SEM of fraction of distance traveled in the center versus total arena.
(E) Mean ± SEM number of wall rearing bouts per session.
(F) Mean ± SEM total time spent grooming.
(G) Mean ± SEM duration of individual grooming bouts.
(H) Mean ± SEM number of grooming bouts per session.
(I) Mean ± SEM latency to fall in the accelerating rotarod test.

