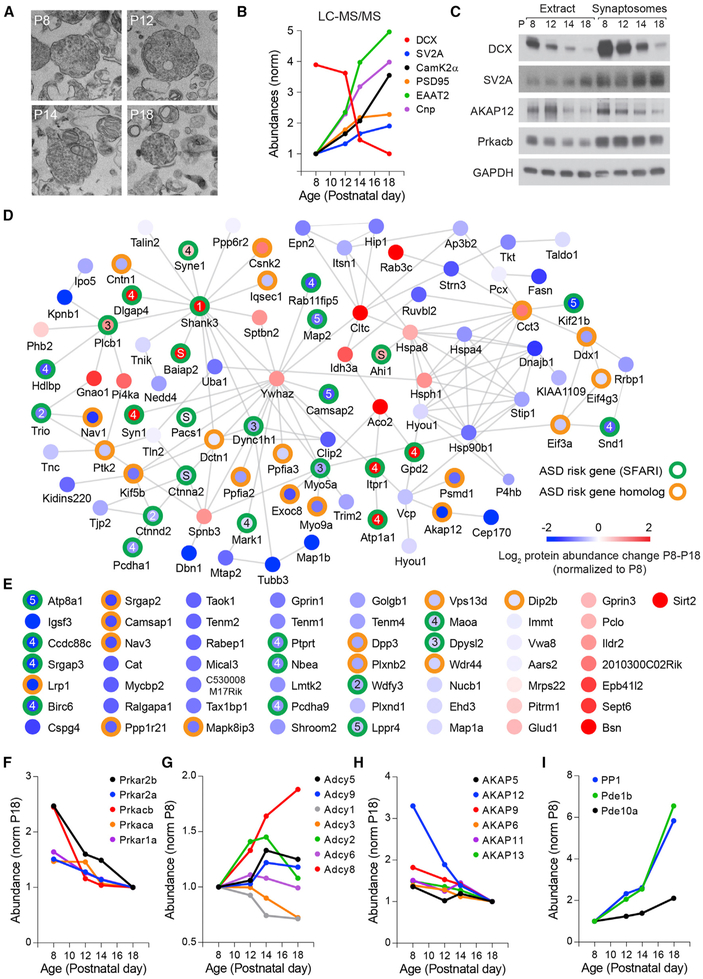
Figure 2. Dynamic Regulation of PKA and ASD Risk Factors during Postnatal Striatal Development.
(A) Electron microscopy images of synaptosomal fractions isolated from mouse dorsal striatum at P8–P18.
(B) Developmental trajectory of the relative abundance of several proteins associated with synaptic and neural circuit maturation identified by LC-MS/MS.
(C) Immunoblot analysis of proteins in whole extracts or isolated synaptosome fractions of dorsal striatum from P8–P18 mice.
(D) Protein-protein interaction network of proteins of striatal synaptosomes with significant abundance change between P8 and P18. The color of the node center represents changes in protein abundance during this period with proteins (red, increased expression; blue, lower expression; log2 normalized to P8 levels). Green and orange circles around the nodes label ASD risk factors identified in SFARI gene list or closely related homologs, respectively. Nodes with numbers and letters represent the SFARI gene scoring criteria (1–5, confidence categories; S, syndromic). Edges represent protein-protein interactions pooled from Genemania, STRING, and BioGRID online databases.
(E) Proteins of striatal synaptosomes with significant change in abundance between P8 and P18 with no known protein-protein interactions. Labeling of nodes similar to that represented in (D).
(F–I) Normalized relative change in abundance from P8 to P18 of (F) catalytic and regulatory PKA subunits, (G) adenylyl-cyclases, (H) AKAPs, and (I) negative regulators of PKA signaling protein-phosphatase-1 and phosphodiesterases 1B and 10A.

