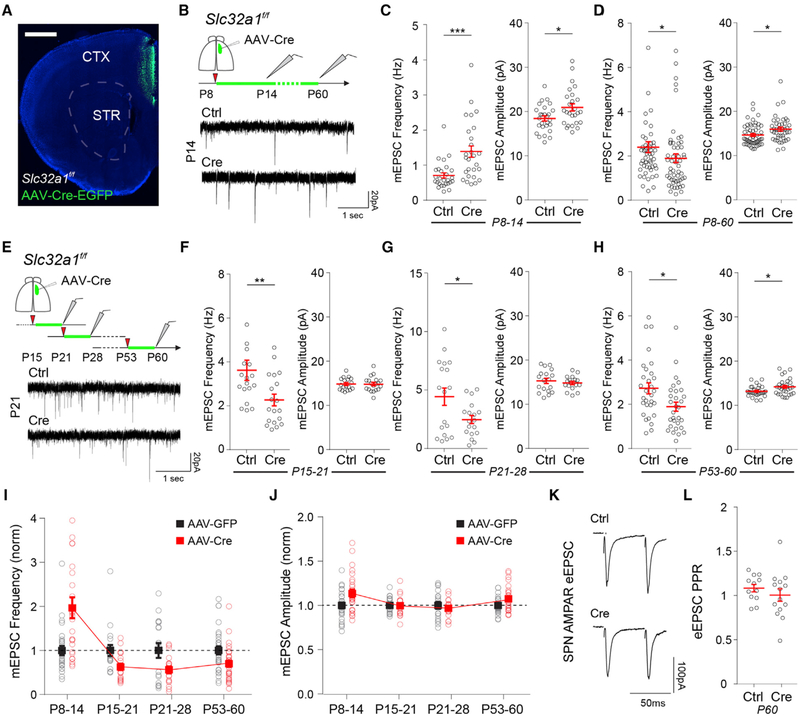
Figure 3. Developmental Switch in SPN Response to Cortical Hyperactivity.
(A) Coronal brain section of Slc32a1f/f mouse injected with AAV-Cre-EGFP in ACC. Scale bar, 1 mm. CTX, cortex; STR, striatum.
(B) Whole-cell voltage-clamp recordings in SPNs of DMS in acute brain slices of P14 or P60 Slc32a1f/f mice injected at P8 with AAV-EGFP (Ctrl) or AAV-Cre-EGFP (Cre) in the ACC.
(C and D) Mean ± SEM of AMPAR mEPSC frequency (left) and amplitude (right) of (C) P14 or (D) P60 SPNs of Slc32a1f/f mice injected at P8.
(E) Experimental diagram depicting whole-cell voltage-clamp recordings in SPNs of DMS in acute brain slices of P21, P28, or P60 Slc32a1f/f mice injected with AAV-EGFP (Ctrl) or AAV-Cre-EGFP (Cre) 7 days before recordings. Bottom traces are representative mEPSC recordings performed at P21 of mice injected at P15.
(F–H) Mean ± SEM of AMPAR mEPSC frequency (left) and amplitude (right) of (F) P21, (G) P28, and (H) P60 SPNs of Slc32a1f/f mice injected 7 days before recordings.
(I and J) Normalized values of SPN AMPAR (I) mEPSC frequency and (J) mEPSC amplitude of AAV-Cre-injected animals compared to AAV-EGFP controls across development. Note the developmental shift in the change of mEPSC frequency after AAV-Cre-EGFP injections at ~P15.
(K) Example traces of eEPSCs in SPNs of P60 Slc32a1f/f mice injected with AAV-EGFP (Ctrl) or AAV-Cre-EGFP (Cre) in response to paired electrical pulses with 50 ms inter-stimulus interval (ISI).
(L) Mean ± SEM ratio of eEPSC amplitude in response to the two electrical stimuli in (K).

