
Figure 2.
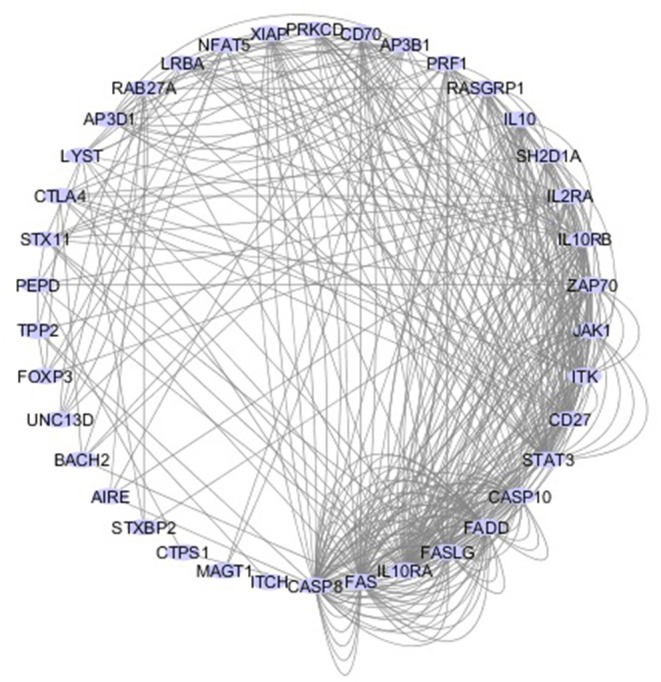
Network of 40 genes that cause PIDs associated with immune dysregulation. The interactive circular graph illustrates the connections (e.g., physical interaction, common signaling pathways, co-localization.) between the causative genes and was developed using the GeneMANIA Cytoscape plugin (47). The genes were provided as a query and are represented by the blue nodes while their connections are represented by the gray lines. Related genes are closer together in the network and have more connecting lines among them.