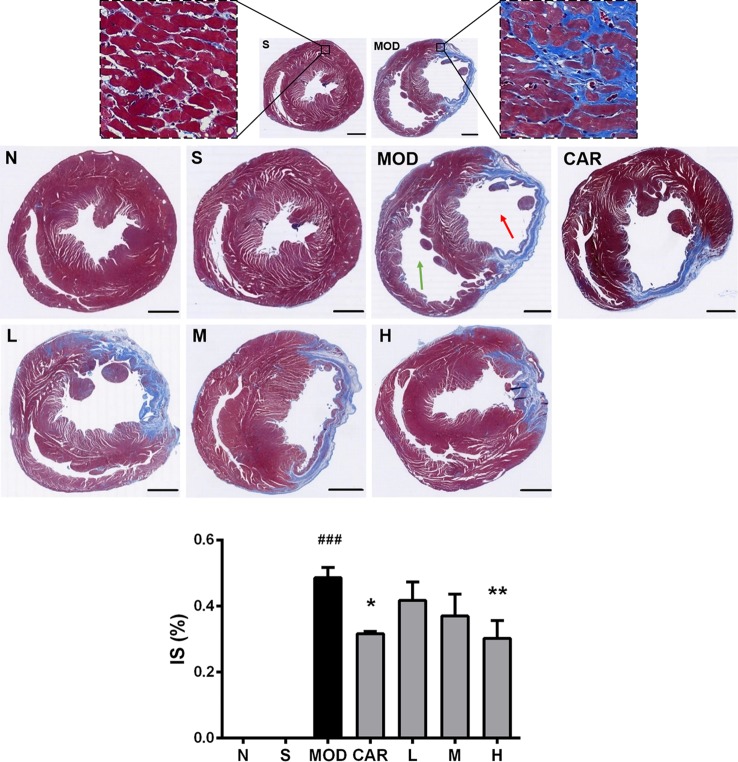
Figure 6.
Photomicrographs of Masson’s trichrome-stained heart sections of rats from each group after coronary artery ligation. The magnification of the cross-sectional photomicrographs is 5.1× (scale bar, 2000 μm in each panel). The magnification of the local enlarged photomicrographs near the coronary vein is 200× (scale bar, 50 μm in each panel). The red arrow indicates the left ventricle, whereas the green one indicates the right ventricle. The infarct size was analyzed using Image-Pro Plus. N, normal (n = 4); S, sham (n = 4); MOD, model (n = 5); CAR, carvedilol (n = 4); L, 3 ml/kg Shenfu injection (n = 4); M, 6 ml/kg Shenfu injection (n = 4); H, 12 ml/kg Shenfu injection (n = 4). Data are expressed as mean ± standard error of the mean. ### P < 0.001 vs. S group; *P < 0.05, **P < 0.01 vs. MOD group.

