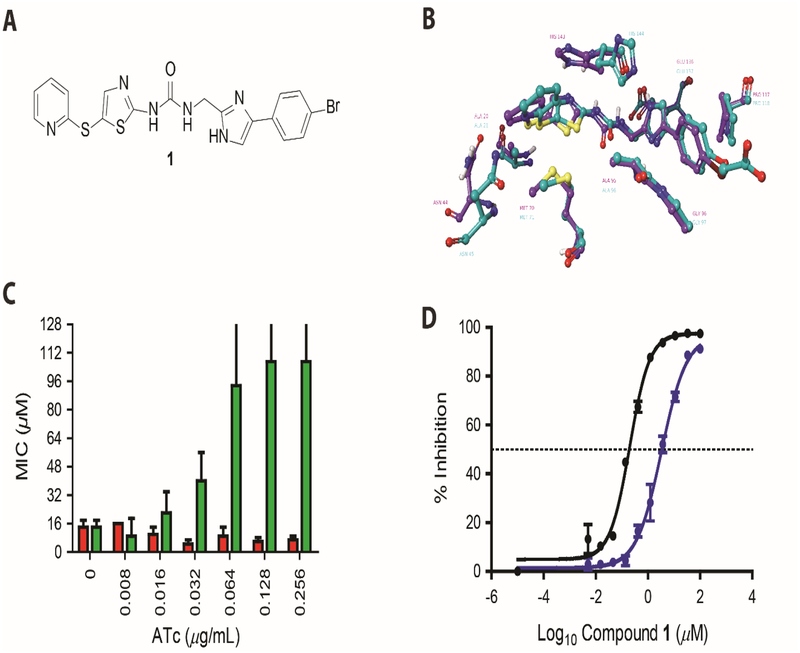
Figure-3: Characterization of compound 1 activity against CdFabK.
(A) Chemical structure of phenylimidazole derivative 1. (B) Homology modeling of 1 in active site of FabK. The comparative model of the C. difficile FabK (green) is shown aligned with the experimental model of S. pneumoniae FabK. Compound 1 is shown docked into the C. difficile FabK active site, closely recapitulating the experimental structure of the bound compound, which is an analog 1. Active site residues are visible within 3 angstroms of the inhibitor, showing 100% identity between the binding sites of the two enzymes. (C) Minimum inhibitory concentrations (MICs) for 1 against C. difficile CD630 overexpressing FabK. MIC’s for C. difficile CD630 harboring respective plasmids were analyzed in BHI broth with respective concentration of compounds. The MIC’s against empty vector control pRPF185 (red bars) and FabK overexpressing pPRPF185-fabK (green bars) are shown for 4 biological replicates. The data included MIC’s that were >128 μM, as reflected by error bars beyond 128. (D) Sigmoidal plot showing inhibition of CdFabK (purple line) and SpFabK (black line) to NADH by 1. The assay was performed with fixed concentration of cofactor and substrate but three-fold dilution of the 1 ranging from 100 to 0.005 and 33 to 0.0017 μM respectively for CdFabK and SpFabK. NADH fluorescence was measured at 340/460 nm and the IC50 values were determined through Hill curve analysis in Graph pad prism 7.

