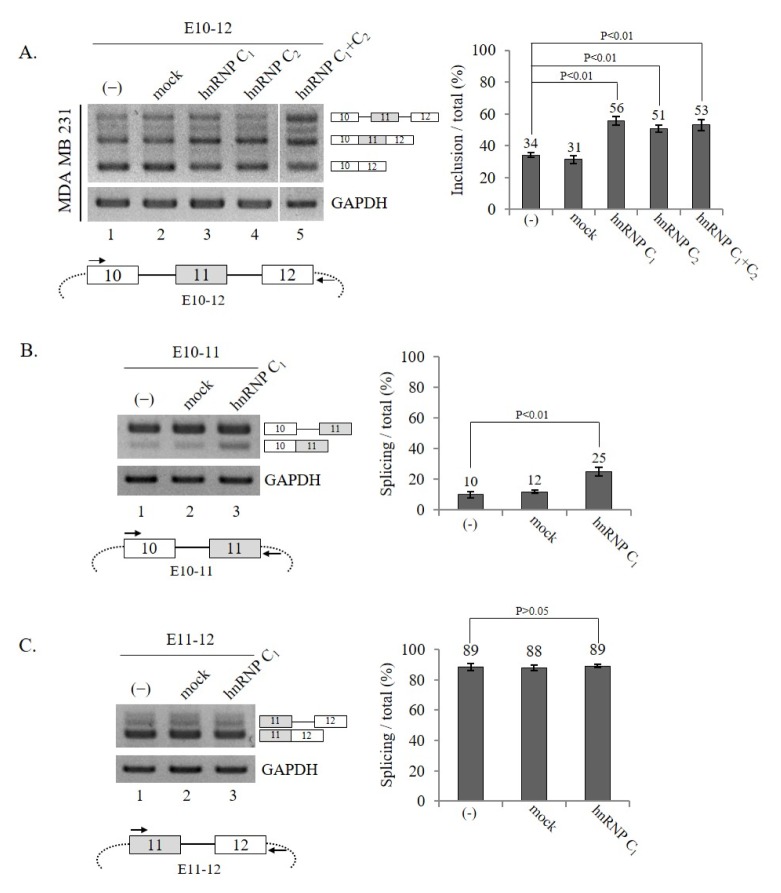
Fig. 2.
hnRNP C1 and hnRNP C2 promote exon 11 splicing of Ron pre-mRNA independently. (A) (Upper panel) Shown are RT-PCR results of Ron exon 11 splicing from the E10–12 mini-gene in MDA MB 231 cells expressing hnRNP C1, hnRNP C2, or both hnRNP C1 and C2. The quantitation results are shown on the right. (Lower panel) The scheme of Ron mini-gene (E10–12) is shown. The intronic RNA is represented with solid lines and the vector sequence is shown as dot lines. The primers used to detect the mini-gene splicing are shown with arrows. (B, C) hnRNP C1 promotes intron 10 but not intron 11 splicing of Ron pre-mRNA. (B) (Upper panel) RT-PCR analysis of intron 10 splicing from cells expressing hnRNP C1 is shown with GAPDH as a loading control. The quantitation results are shown on the right. (Lower panel) The scheme of the E10–11 mini-gene is shown. The intronic RNA is represented with solid lines and the vector sequence is shown as dotted lines, and the primers used to detect intron 10 splicing are shown as arrows. (C) (Upper panel) RT-PCR analysis of intron 11 splicing is shown, with GAPDH as a loading control. The quantitation results are shown in the right panel. (Lower panel) The scheme of the E11–12 mini-gene is shown. The primers used to detect intron 11 splicing are shown with arrows.

