Fig. 1.
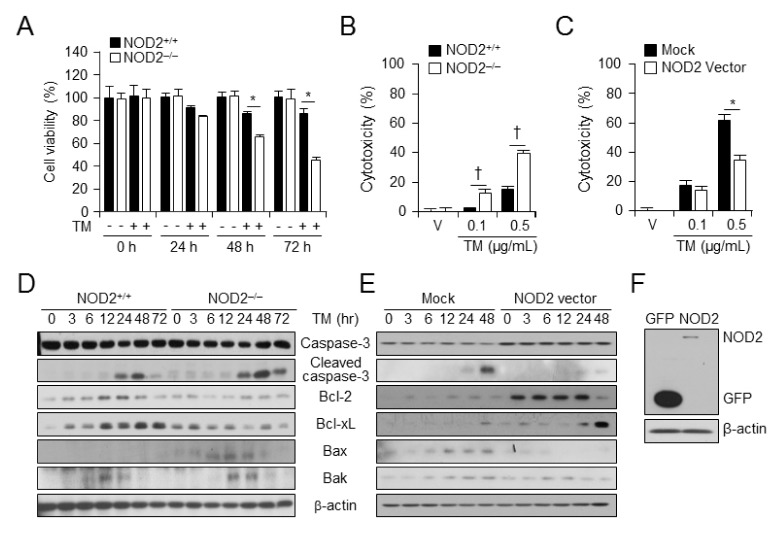
NOD2 deficiency accelerates ER stress induced-cell death. (A) Cell viabilities of NOD2+/+ and NOD2−/− VSMCs were measured after vehicle or TM (100 ng/ml) administration. *P < 0.05, decreased cell viability of NOD2−/− vs. NOD2+/+ VSMCs in the presence or absence of tunicamycin. Values are presented as mean ± SD (n = 12). (B) NOD2+/+ and NOD2−/− VSMCs were treated with vehicle or TM for 48 h. LDH cytotoxicity assay was assessed and represented as a graph. Values are presented as mean ± SD (n = 12). †P < 0.05, enhanced cell toxicity of NOD2−/− vs. NOD2+/+ VSMCs in the presence of TM. (C) Control vector- or NOD2-overexpressed VSMCs were treated with vehicle or TM for 48 h. LDH-cytotoxicity assay was performed. Results are presented as a graph. Values are shown as mean ± SD (n = 12). *P < 0.05, decreased cell toxicity NOD2- overexpressed VSMCs vs. control vector-expressed VSMCs in the presence of TM. (D) Levels of caspase-3, cleaved caspase-3, Bcl-2, Bcl-xL, Bax, Bak, and β-actin were determined at indicated time points after TM (100 ng/ml) treatment by western blot analysis in NOD2−/− vs. NOD2+/+ VSMCs. Representative blot of three independent experiments. (E) Levels of caspase-3, cleaved caspase-3, Bcl-2, Bcl-xL, Bax, Bak, and β-actin were determined at indicated time points after TM (100 ng/ml) treatment by western blotting in control vector or NOD2-overexpressed VSMCs. Representative blots of three independent experiments are shown. (F) NOD2 overexpression was analyzed using FLAG antibody. β-actin was used as a loading control.

