FIGURE 1.

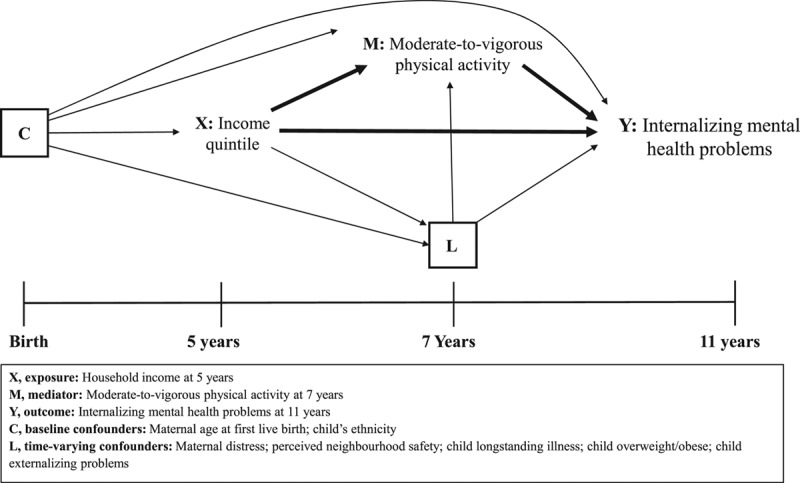
Directed acyclic graph illustrating the relationship between household income (exposure), physical activity (mediator), and internalizing child mental health problems (outcome).

Directed acyclic graph illustrating the relationship between household income (exposure), physical activity (mediator), and internalizing child mental health problems (outcome).