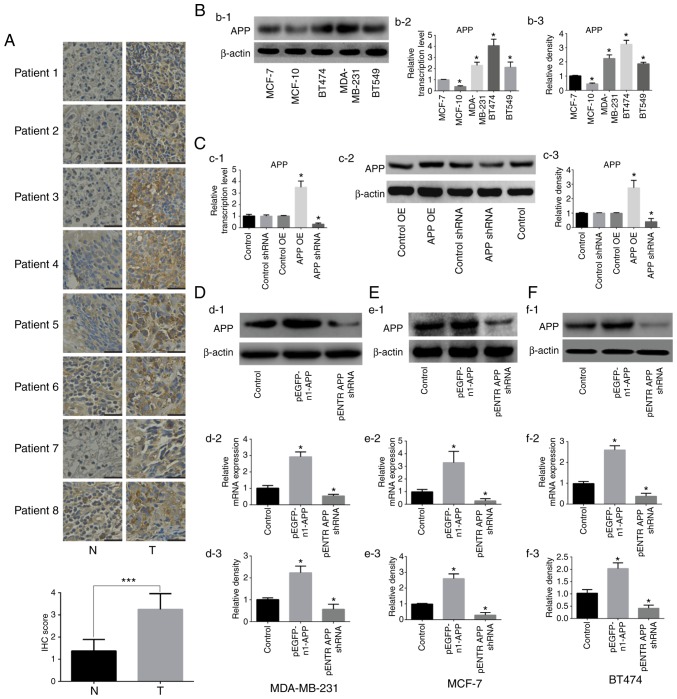
Figure 1.
Expression of APP in human breast cancer tissues and effects of APP overexpression and knockdown in breast cancer cell lines. (A) APP expression in human breast cancer tissues by immunohistochemistry and statistical analysis. APP-positive staining was indicated by a brown color. Magnification, ×200. Scale bar, 100 µm. (Bb-1) Representative protein expression bands of APP in different human breast cancer cell lines. (Bb-2) RT-qPCR results of mRNA expression levels of APP. (Bb-3) Densitometric analysis of the protein expression level of APP. (Cc-1) Empty plasmids have no effect on the mRNA expression level of APP in MDA-MB-231 cells. (Cc-2) Protein expression of APP and (Cc-3) statistical results. (Dd-1) Representative images of APP protein expression by western blot analysis following APP overexpression and knockdown in MDA-MB-231 breast cancer cells. (Dd-2) APP mRNA expression in MDA-MB-231 breast cancer cells using RT-qPCR. (Dd-3) Statistical analysis of the protein expression level of APP. (Ee-1) Protein expression of APP by western blot analysis following APP overexpression and silencing in MCF-7 breast cancer cells. (Ee-2) APP mRNA expression using RT-qPCR in MCF-7 breast cancer cells. (Ee-3) Statistical analysis of the protein expression level of APP. (Ff-1) APP protein expression was analyzed by western blot analysis following APP overexpression and knockdown in BT474 breast cancer cells. (Ff-2) RT-qPCR results of the mRNA expression levels of APP in BT474 breast cancer cells. (Ff-3) Statistical analysis of the protein expression level of APP. Results are representative of three independent experiments. Data are presented as the mean ± SD. *P<0.05 vs. corresponding control. ***P<0.001. APP, amyloid precursor protein; OE, overexpression; PEI, polyetherimide; N, adjacent normal tissue; T, tumor tissue; RT-qPCR, reverse transcription-quantitative PCR; shRNA, short hairpin RNA.

