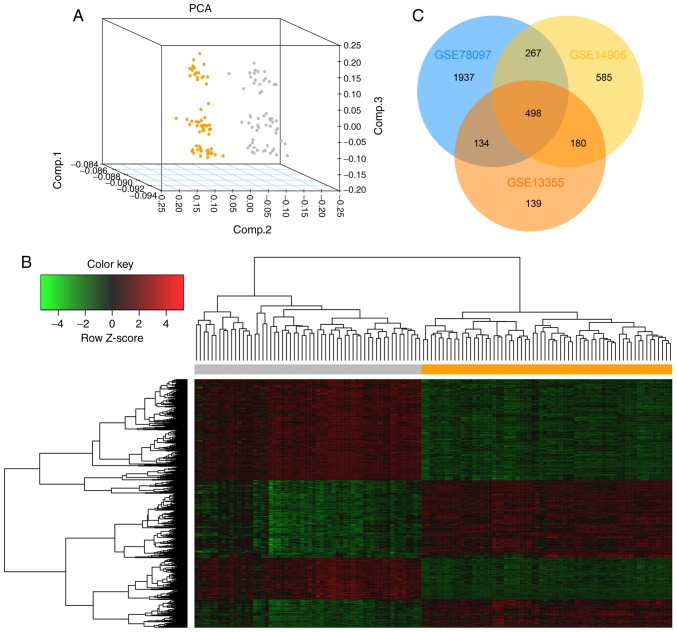
Figure 1.
Identification of DEGs in psoriasis. (A) Principal component analysis of the samples in the GSE13355 dataset. The results revealed that psoriasis samples and normal samples could be well distinguished according to these DEGs. Orange dots represent normal samples and gray dots represent psoriasis samples. (B) Hierarchical cluster analysis of DEGs in GSE13355. Gene expression levels were indicated by colors: Red represents high expression level, green represents low expression level. The orange area represents normal samples and the gray area represents psoriasis samples. (C) Venn diagram of overlapping DEGs from 3 microarray datasets (GSE13355, GSE14095 and GSE78097). A |log2FC|>1 and P-value <0.05 were set as the cut-off criteria. DEGs, differentially expressed genes; FC, fold change.

