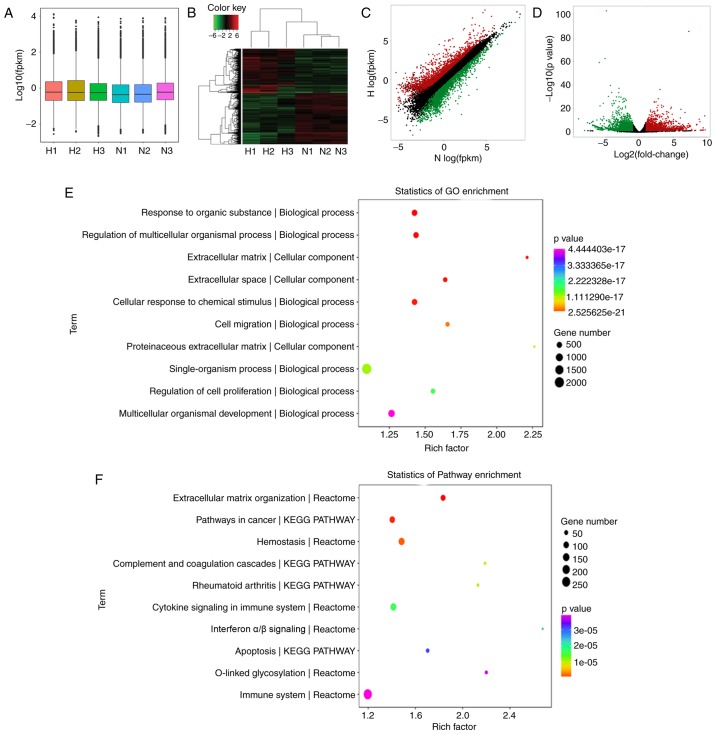
Figure 3.
Differential expression of mRNA in HFL-1 cells cultured in hypoxic and normoxic conditioned medium from HMC-1 cells. (A) Box plot of RNA sequencing dataset after normalization. (B) Hierarchical clustering of differentially expressed mRNAs in HFL-1 hypoxic group and normoxic controls. (C) Scatter plots demonstrated differential mRNA expression between hypoxic and normoxic samples. The red circles indicate upregulated genes, the green circles represent downregulated genes, and black circles indicate unchanged genes. (D) Volcano plots were generated to visualize the mRNA expression profiles between hypoxic and normoxic samples. (E and F) GO enrichment and KEGG analysis of differentially expressed mRNAs in HFL-1 cells cultured in the hypoxic and normoxic conditioned medium from HMC-1 cells. HFL-1, human lung fibroblasts; GO, Gene Ontology; KEGG, Kyoto Encyclopedia of Genes and Genomes; H, hypoxia; N, normoxia; HMC-1, human mast cells; HFL-1, human fetal lung fibroblasts.

