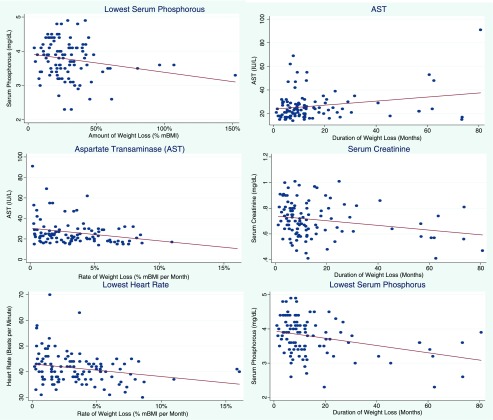
FIGURE 2.
Significant associations between weight history variables and markers of illness severity. Dots depict the unadjusted association between the weight loss variable and marker of illness severity for each participant. The line illustrates the predicted relationship from multivariable linear regression adjusted for admission percentage of mBMI. β coefficients with 95% CIs, P values, and adjusted R2 from adjusted multivariable linear regression are shown. Findings were as follows. Lowest serum phosphorous (amount): β = −.005 (95% CI −.010 to .000); P = .04; adjusted R2 = 0.074. AST (duration): β = .171 (95% CI .031 to .312); P = .02; adjusted R2 = 0.076. AST (rate): β = −1.24 (95% CI −2.25 to .228); P = .02; adjusted R2 = 0.076. Serum creatinine: β = −.002 (95% CI −.003 to −.000); P = .01; adjusted R2 = 0.044. Lowest HR: β = −.492 (95% CI −.883 to −.100); P = .01; adjusted R2 = 0.070. Lowest serum phosphorous (duration): β = −.011 (95% CI −.017 to−.005); P = .001; adjusted R2 = 0.044.

