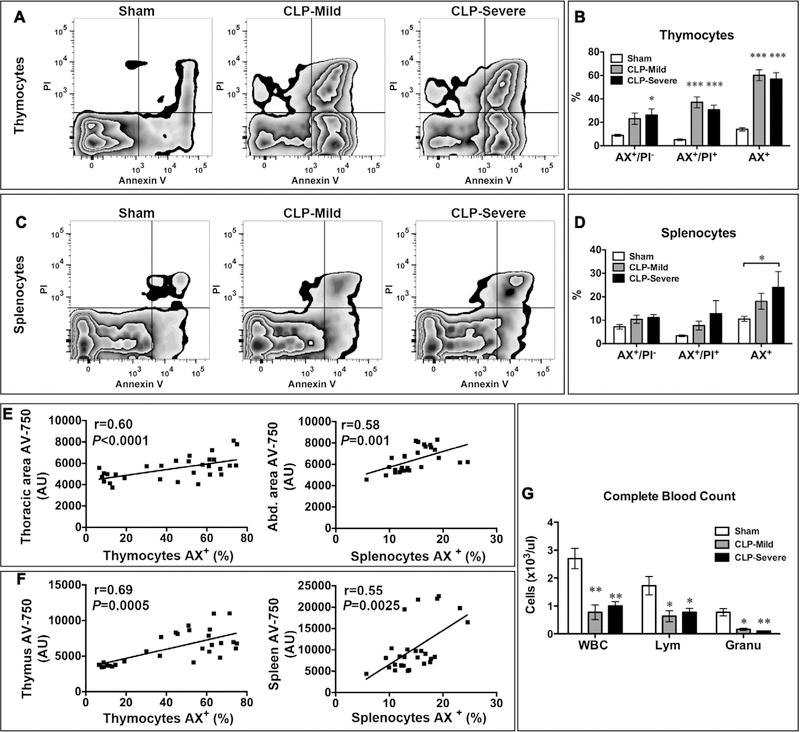
Figure 4.
Sepsis-induced lymphoid cell death correlates with AV-750 imaging in vivo and ex vivo. Right after AV-750 imaging, the thymi or spleens were gently ground to dissociate the cells. Thymocytes and splenocytes were stained with fluorescein-labeled annexin V (AX) and propidium iodide (PI). Flow cytometry were used to define the percentage of apoptosis, necrosis, and total cell death population. A, Representative picture of thymocyte flow cytometry. B, Mild and severe sepsis led to increased apoptosis (AX+/PI−), necrosis (AX+/PI+), and total cell death (AX+) in thymocytes. n = 5 in the sham group and n = 6 in the CLP group. *p < 0.05 and ***p < 0.001 versus sham. C, Representative picture of flow cytometry in splenocytes. D, Mild and severe sepsis increased splenocyte cell death. n = 6 in each group. *p < 0.05 versus sham. E, In vivo thoracic AV-750 signal correlates with thymocyte cell death. In vivo abdominal AV-750 signal correlates with splenocyte cell death (AX+, total cell death percentage; n = 28). F, Ex vivo imaging of AV-750 signal in the thymus and spleen correlates with thymocyte and splenocyte death, respectively (AX+, total cell death percentage; n = 28). G, Complete blood count was tested 24 hr after surgery. n = 4 in each group. *p < 0.05 and **p < 0.01 versus sham. AU = arbitrary unit, CLP = cecum ligation and puncture, Granu = granulocyte, Lym = lymphocyte.

