Figure 3.
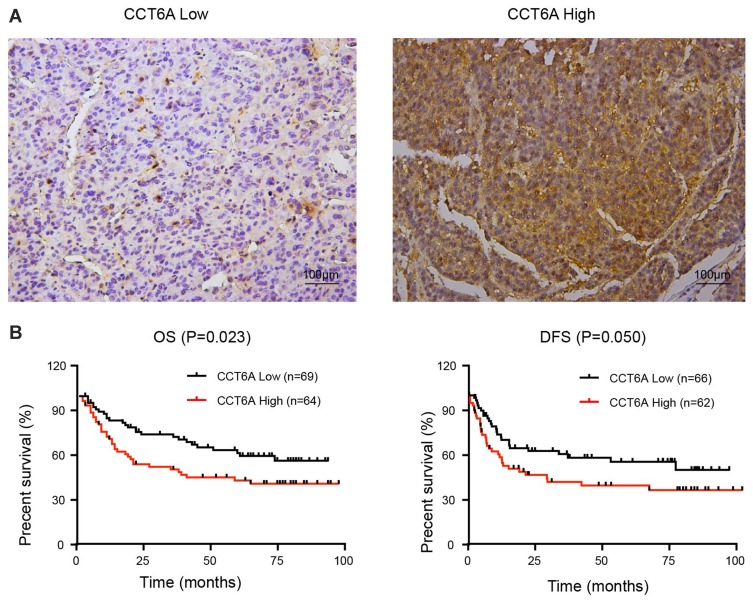
Correlation of CCT6A levels with HCC patient prognosis. (A) Representative images of immunohistochemical staining in HCC tissues. The scale of the upper panel is 100 μm. (B) Correlation of the expression level of CCT6A with overall survival (OS; n = 133, p = 0.023) and disease-free survival (DFS; n = 128, p = 0.050).

