Fig 2.

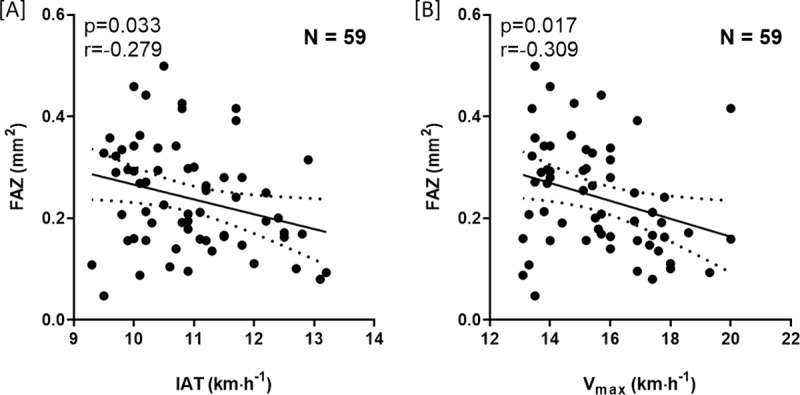
Scatter plots of individual anaerobic lactate threshold (IAT) [A] and maximal exercise capacity (Vmax) [B] and the foveal avascular zone (FAZ). Individual data points are shown with 95% CI and linear regression.

Scatter plots of individual anaerobic lactate threshold (IAT) [A] and maximal exercise capacity (Vmax) [B] and the foveal avascular zone (FAZ). Individual data points are shown with 95% CI and linear regression.