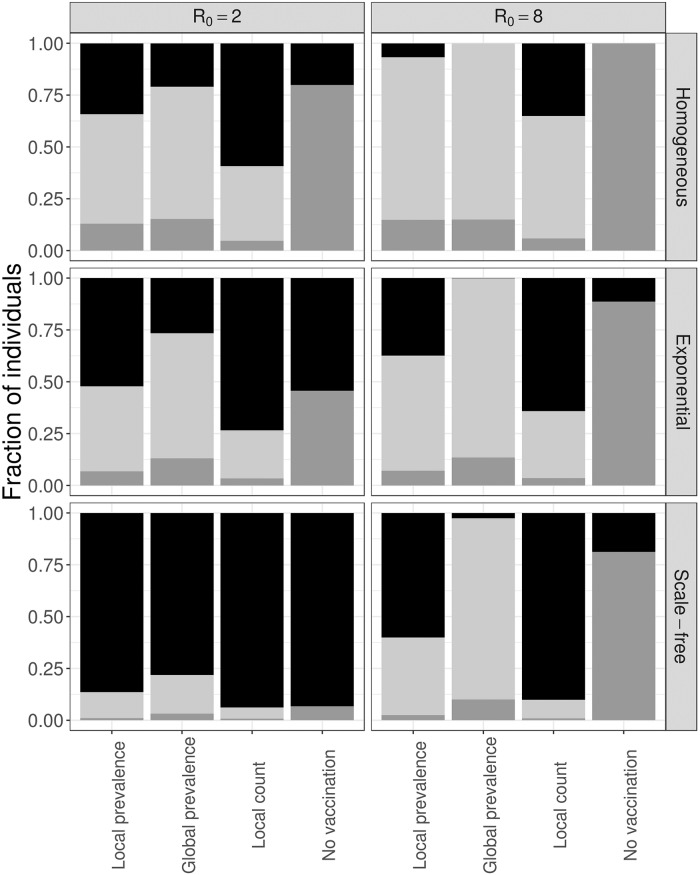
Fig 5. Decision dynamics across social networks.
We compare three different network structures–homogeneous (top), exponential (middle), and scale-free (bottom)–and show the susceptible (black), infected (dark gray) and vaccinated (light gray) for two different values of R0. Results are averages across 500 stochastic simulations.

