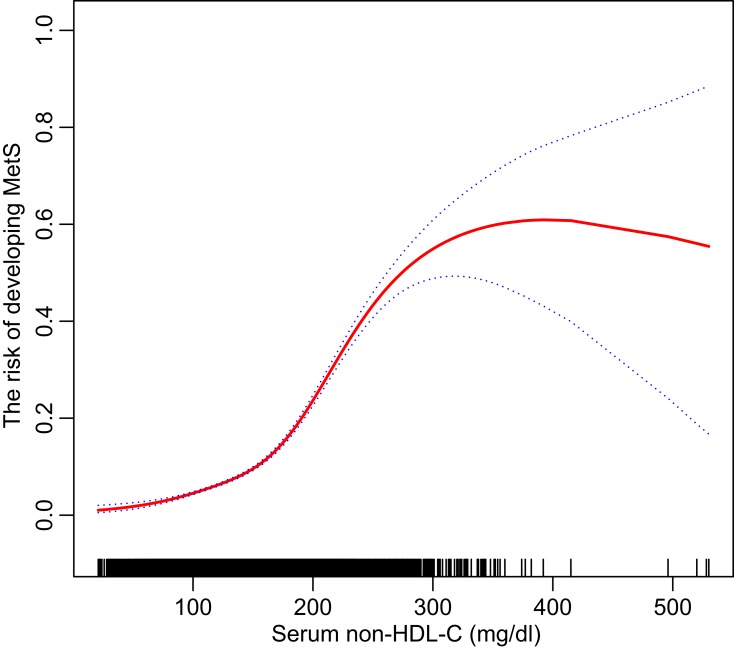
Figure 2.
A non-linear association between the risk of MetS and serum non-HDL-C concentration is showed by using a smooth curve fitting after adjusting for the potential confounders (gender and age). The threshold saturation effects were observed at 118 mg/dl and 247 mg/dl in a two-piecewise linear regression analysis. Dotted lines represented 95% CI.
Abbreviations: MetS, metabolic syndrome; HDL-C, high-density lipoprotein cholesterol; CI, confidence interval.

