
Fig 1.
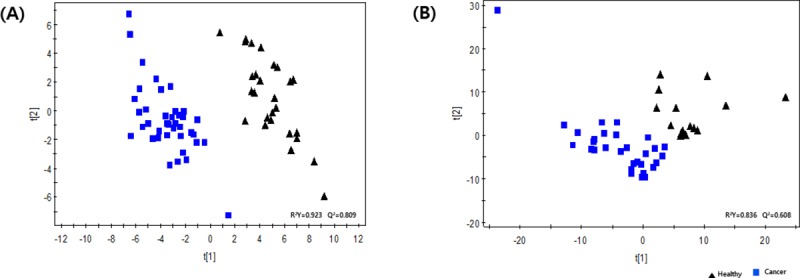
Partial least squares-discriminant analysis score plots of healthy subjects (▲) and cancer patients (■) in the discovery (A) and validation sets (B). Clear separation between the cancer and healthy groups was observed, with all healthy controls being distributed on the right side and most of the breast cancer patients being distributed on the left side in the discovery set. Clear separation was also observed between the two groups in the validation set.