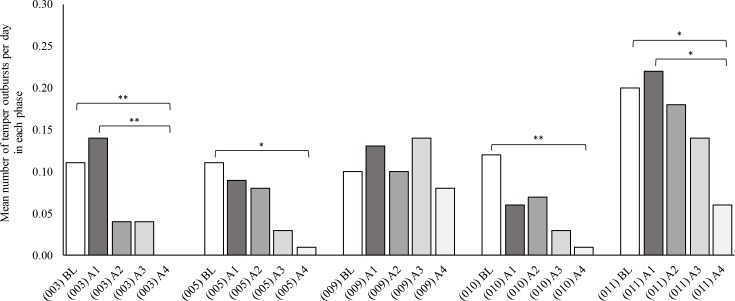
Fig 2. Mean number of temper outbursts per day in each phase for each participant.
BL, baseline phase; A1, first three months of active phase; A2, second three months of active phase; A3, third three months of active phase; A4, fourth three months of active phase. Pairwise comparisons Dunn test. BL compared to A4: 003 (p = ·009); 005 (p = ·021); 010 (p = ·009); 011 (p = ·045). A1 compared to A4: 003 (p = ·003); 011 (p = ·034).

