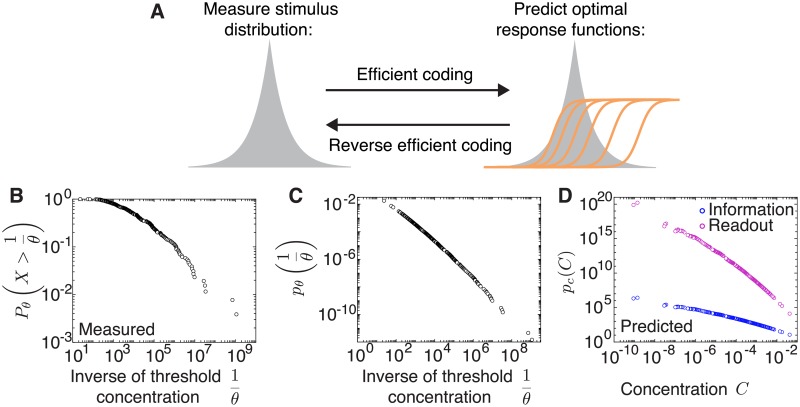
Fig 6. Deriving a distribution of stimulus intensities from experimentally measured thresholds.
A. Our efficient coding framework enables us to predict the optimal distribution of thresholds given a known stimulus distribution. By reversing our framework, we derive the stimulus distribution from a distribution of measured thresholds assuming optimal coding under the two optimality criteria. B. Log-log plot of the cumulative distribution of the inverse of thresholds from measured dose-response curves of the entire population of ORNs in the Drosophila larva olfactory system [37]. This is well described by a power law with exponent −0.42. C. The probability distribution of the inverse of optimal thresholds derived from the data in B. This is well described by a power law with exponent −0.58. D. Predicted distribution of concentrations across different odorants when assuming optimal coding by maximizing information or minimizing the MSE of the best linear decoder. This is well described by a power law with exponents −0.58 and −1.74, respectively. The proportionality constant is not relevant (see Methods).

