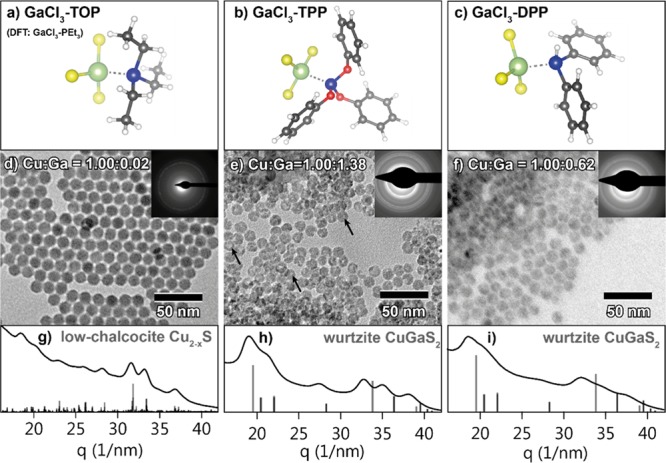
Figure 4.

(Top row) Ground-state geometries of three GaCl3–phosphine complexes obtained from DFT calculations (see below): (a) GaCl3 complexed with triethylphosphine, used as model for GaCl3 complexed with trioctylphosphine (GaCl3–TOP), (b) GaCl3 complexed with triphenylphosphite (GaCl3–TPP), and (c) GaCl3 complexed with diphenylphosphine (GaCl3–DPP). (Middle row) TEM images of product NCs obtained after reaction of Cu2–xS NCs with (d) GaCl3–TOP at 100 °C, (e) GaCl3–TPP at 100 °C, and (f) GaCl3–DPP at 50 °C. Black arrows indicate intraparticle contrast in the NCs reacted with GaCl3–TPP. Top-right insets show the corresponding ED patterns. Bottom row (g–i) shows the corresponding azimuthally integrated ED patterns. Reference bars in (h,i) are calculated patterns based on the wurtzite CuGaS2 crystals structure,44 and reference bars in (g) are based on the low-chalcocite Cu2–xS crystal structure.34
