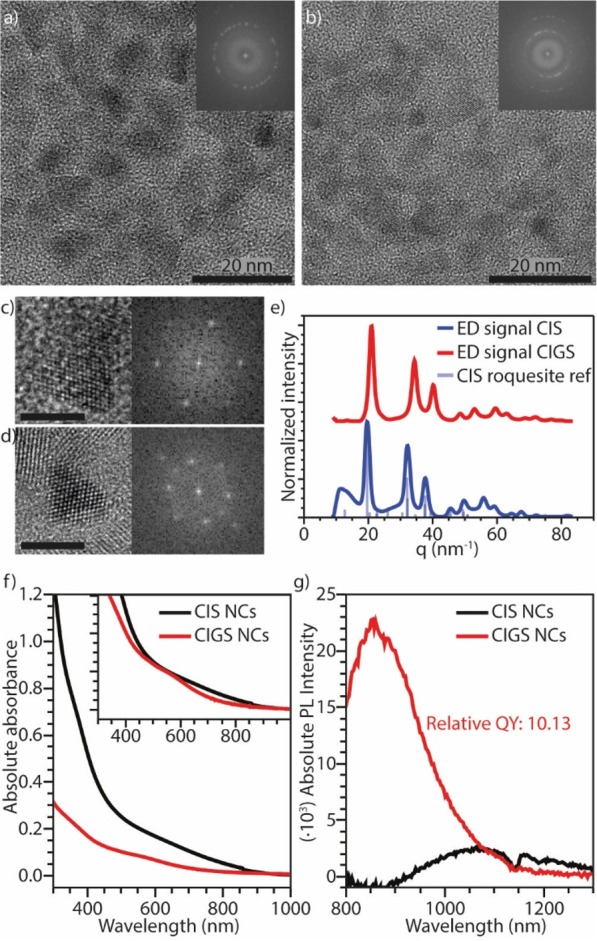
Figure 8.

Cu+ for Ga3+ cation exchange in luminescent CIS NCs. (a) High-resolution TEM image of the parent CIS NCs. The inset shows the FFT of the image. (b) High-resolution TEM image of the product CIGS NCs after reaction; the inset shows the FFT of the image. (c,d) Enlarged TEM image of single NCs before (c) and after (d) the Ga3+ for Cu+ CE reaction, with the corresponding FFTs. Both scale bars correspond to 5 nm. (e) Azimuthally integrated ED patterns of the parent CIS NCs and product CIGS NCs, and bulk roquesite CIS X-ray diffraction reference pattern (JPCDS PDF-card 00-047-1372). (f) Absorption and (g) PL spectra of the parent CIS NCs and product CIGS NCs. The inset in (f) shows the normalized absorption spectra. The PL quantum yield of the product CIGS NCs is at least 10 times higher than that of the parent CIS NCs. The dip in the PL spectrum around 1150 nm is caused by absorption of emitted light by toluene, which was used as solvent.
