Figure 3.

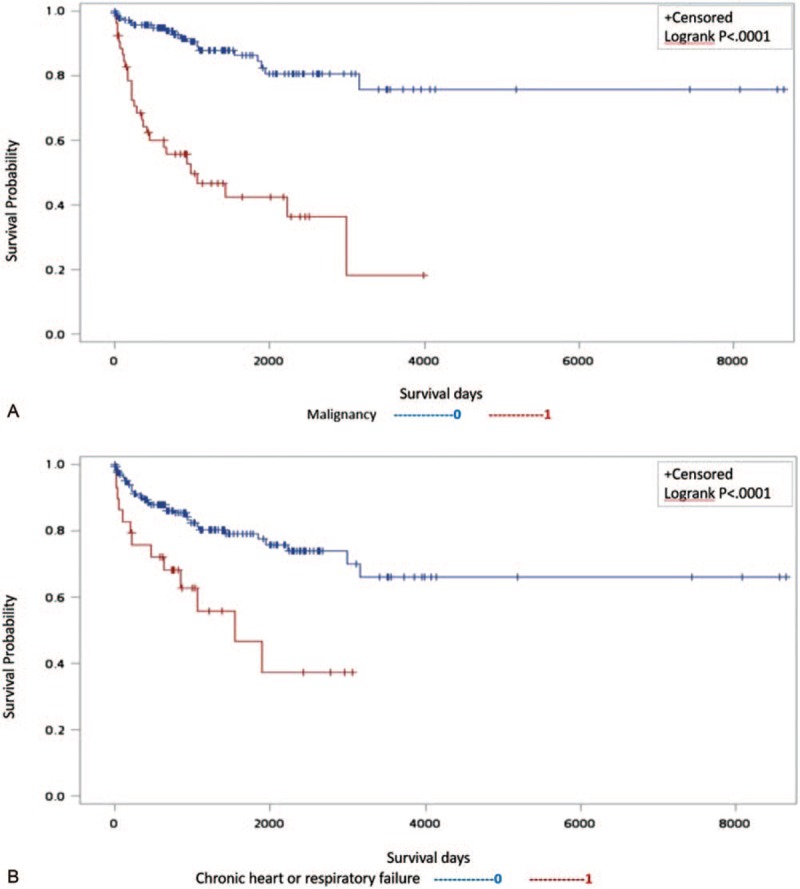
Kaplan–Meier plot representing a significantly worse survival compared with that of patients free from (A) malignancy or (B) chronic heart/lung disease.

Kaplan–Meier plot representing a significantly worse survival compared with that of patients free from (A) malignancy or (B) chronic heart/lung disease.