
Figure 4.
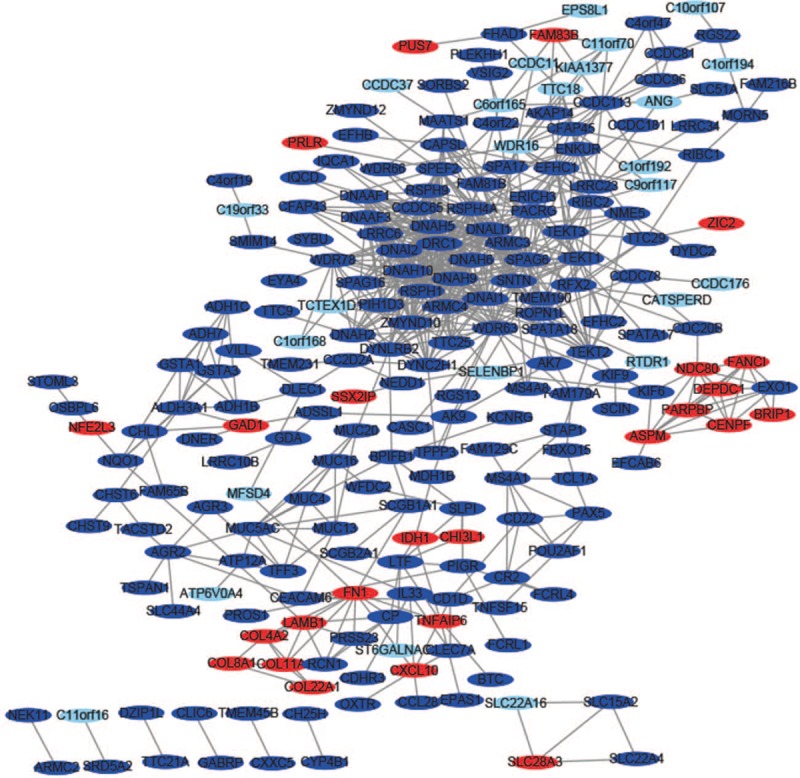
The protein–protein interaction network of differentially expressed genes was constructed using Cytoscape. Upregulated genes are marked in light red; downregulated genes are marked in light blue.
Official websites use .gov
A
.gov website belongs to an official
government organization in the United States.
Secure .gov websites use HTTPS
A lock (
) or https:// means you've safely
connected to the .gov website. Share sensitive
information only on official, secure websites.
The protein–protein interaction network of differentially expressed genes was constructed using Cytoscape. Upregulated genes are marked in light red; downregulated genes are marked in light blue.