
Figure 1.
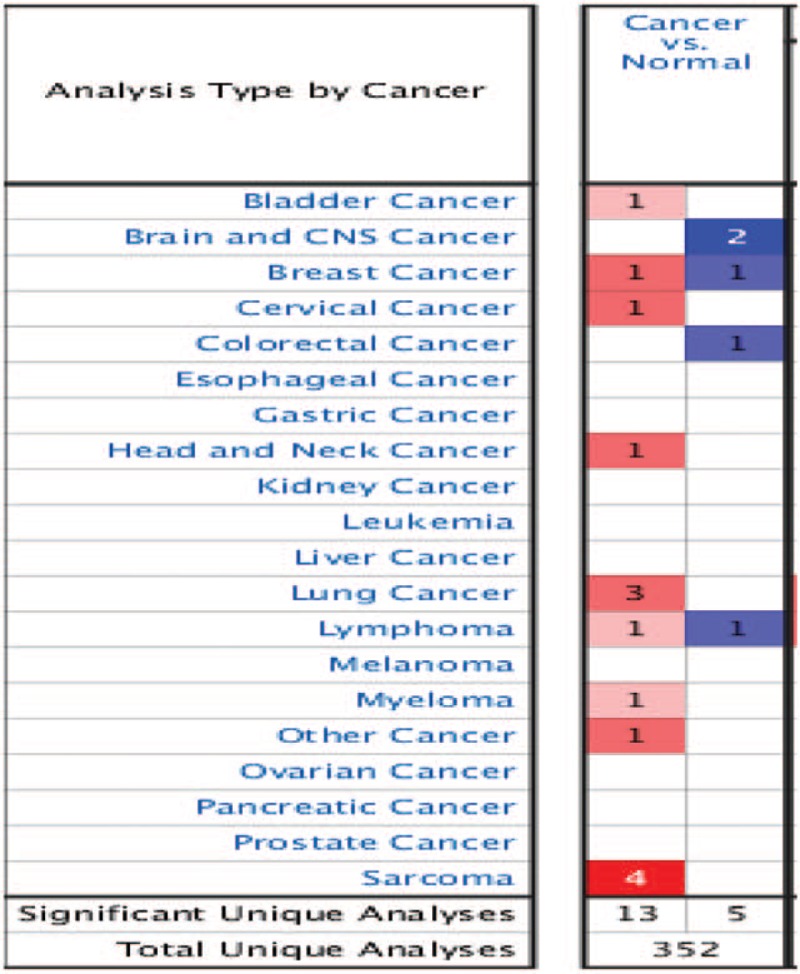
Oncomine analysis of expression levels of Drp1 across different cancers. Differences in expression levels of the genes between tumor and normal tissue are summarized in the Fig. The number of unique analyses satisfying the thresholds (P ≤ .01; fold change ≥2; gene rank ≤10%; data type: mRNA) are indicated in the colored cells. Red cells represent overexpression of the target gene, in tumor tissues compared to normal, whereas blue cells indicate downregulation of the same. Gene rank is depicted by the color depth in the cells. CNS = central nervous system.