
Figure 3.
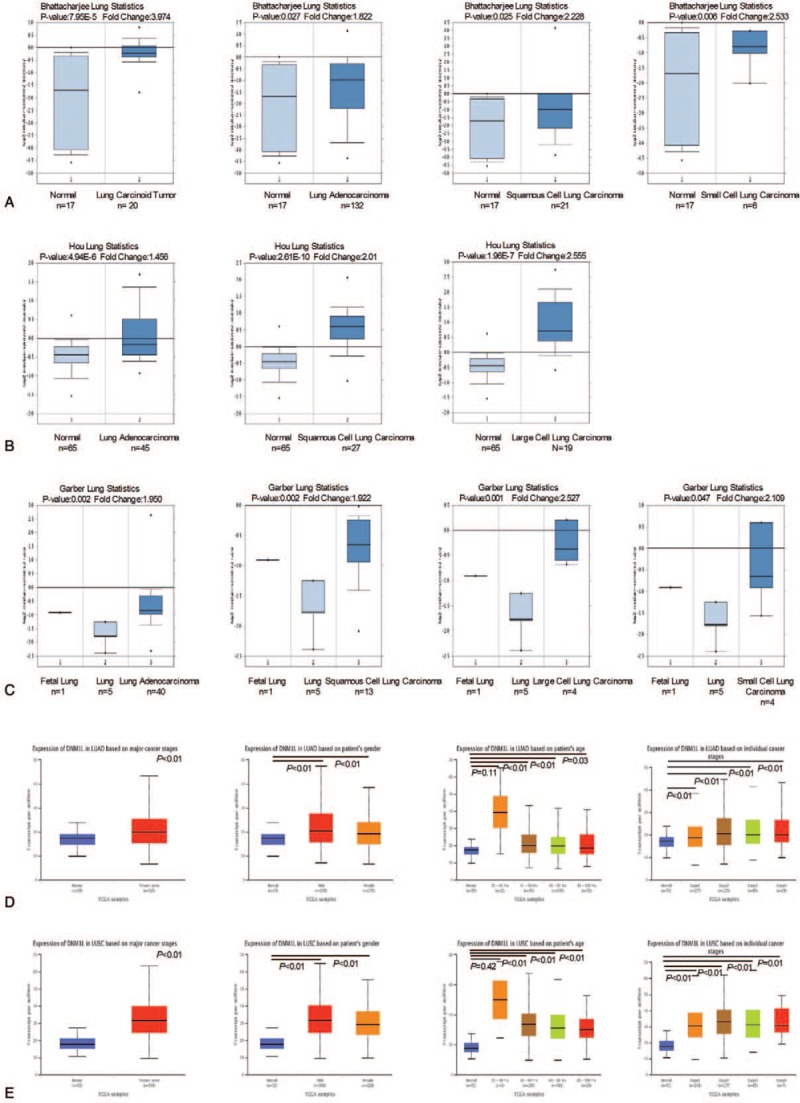
mRNA expression of Drp1 in lung cancer and subtypes using Oncomine database and The Cancer Genome Atlas (TCGA). (A) Drp1 mRNA expression in lung cancer subtypes in Bhattacharjee dataset. (B) Drp1 mRNA expression in lung cancer subtypes in Hou dataset. (C) Drp1 mRNA expression in lung cancer subtypes in Garber's datasets. X-axis of the plot represents normal vs cancer group, Y-axis represents mRNA expression in log2 median/mean centered intensity. The line in the middle represents the median value. (D) Drp1 mRNA expression in LUAC in TCGA database. (E) Drp1 mRNA expression in LUSC in TCGA database. X axis of the plot represents normal vs cancer group, Y axis represents mRNA expression in transcript per million. P < .05 were considered significant.