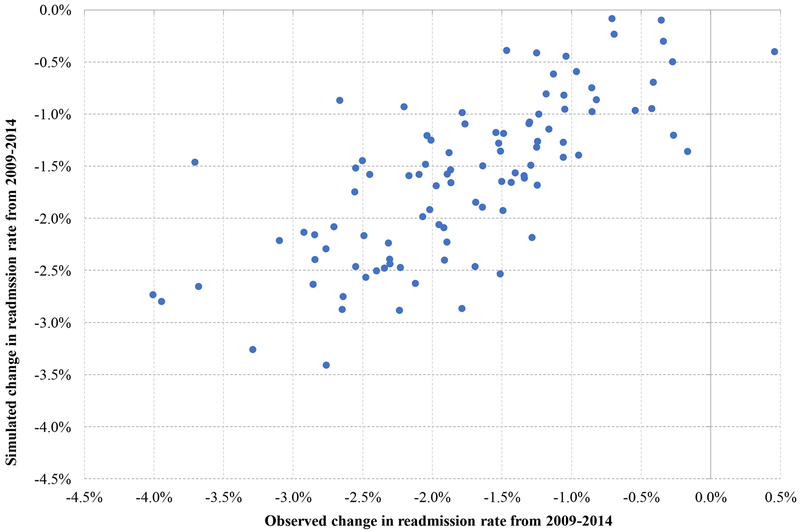
Exhibit 3. Correlation between simulated and observed changes in readmission rates from 2009-2014 at the HRR level.
Source: Authors’ analysis of Medicare claims from 2009-2014
Notes: Simulated HRR-specific changes in readmission rates from 2009-2014 are plotted against observed HRR-specific changes. Simulated changes were produced under the assumption that readmissions are causally unrelated to preceding index admissions. To reduce attenuation bias from sampling error in the estimation of the correlation between the simulated and observed changes, we focused this analysis on the 100 largest HRRs accounting for 67% of the Medicare population and used claims for all beneficiaries in those HRRs (as opposed to claims for the 20% sample of beneficiaries). The correlation was even higher (0.84; P<0.001) among the 50 largest HRRs.

