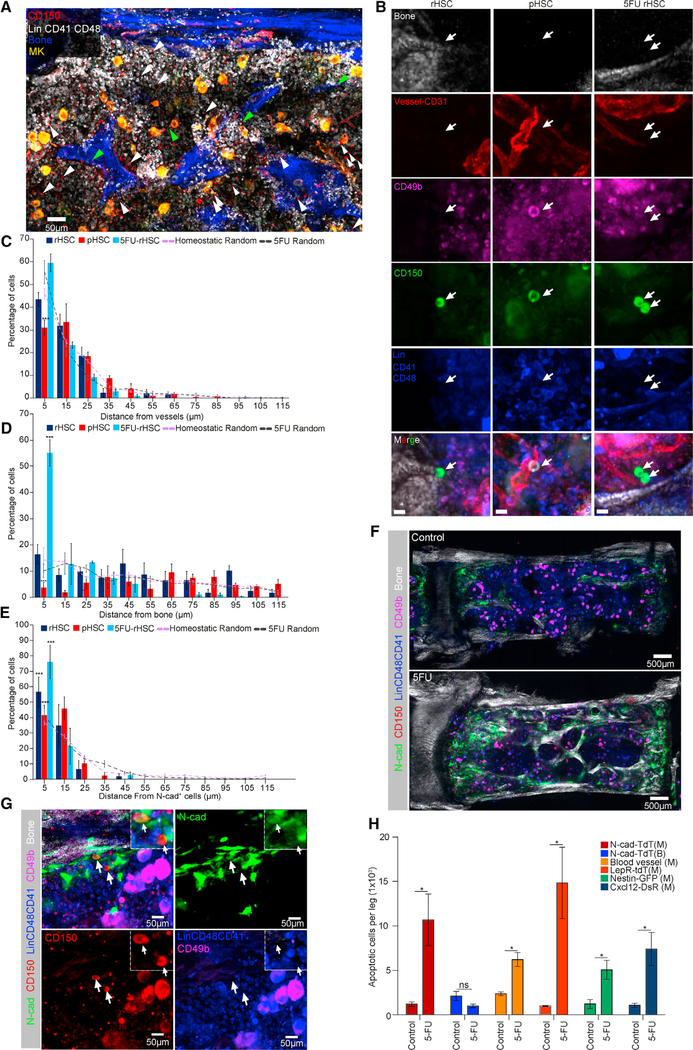
Figure 2. rHSCs Located by N-Cad+ Endosteal Region in BM Niche.
(A) Representative whole-mount images of sternum, with bone (white by SHG) and megakaryocytes (MKs) (yellow, distinguished by size, morphology, and CD41 expression). Green and white arrowheads denote phenotypic rHSCs (Lin−CD48−CD41−CD150+CD49b−) and pHSCs (Lin−CD48−CD41−CD150+CD49b+).
(B) Representative images of rHSCs, pHSCs, and 5FU rHSCs (arrows). Scale bar, 10 μm.
(C–E) Relative distance between rHSCs, pHSCs, and 5FU rHSCs to BVs (C), bone (D), or N-cad+ cells (E) (n = 51 rHSCs, n = 144 pHSCs, n = 102 5FU rHSCs in distance quantification of HSCs from BVs and bone; n = 40 rHSCs, n = 50 pHSCs, n = 34 5FU rHSCs in distance quantification of HSCs from N-cad+ cells). n = 3 mice for each distance quantification dataset.
(F) Representative whole-mount images of N-cad-CreERT; R26-ZsG mice induced by TMX for 24 h, co-stained with CD150, Lin, CD41, CD48, and CD49b as well as SHG signal (control and day 3 after 5FU).
(G) The rHSCs (arrows) localized near the N-cad+ bone surface after 5FU. Dashed-lined higher-power image (inset) shows one N-cad+ rHSC and one N-cad− rHSC.
(H) Absolute numbers of AnnexinV+ SytoxG− stromal cells in control and day 3 post-5FU (n = 3). *p < 0.05, **p < 0.01, ***p < 0.001. Error bars, SEM.

