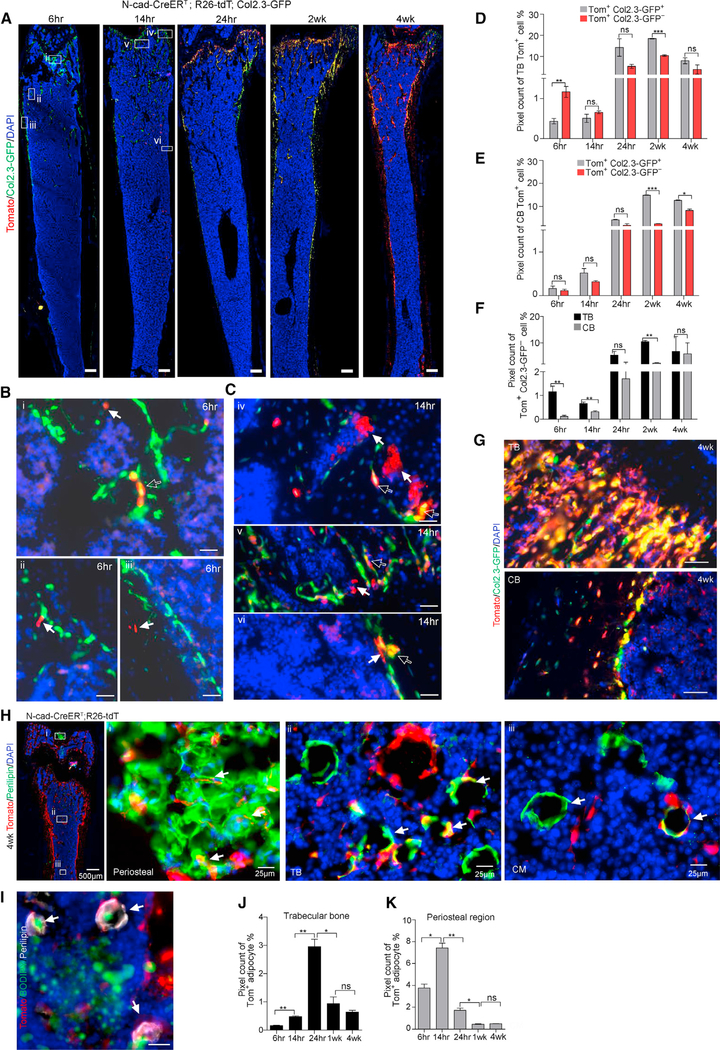
Figure 6. N-Cad+ Stromal Cells Give Rise to Osteoblasts and Adipocytes in Adult Mice.
(A) Representative images of N-cad-CreERT; R26-tdT; Col2.3-GFP mice at indicated time post-TMX showing Tom+Col2.3-GFP+ osteoblasts. Scale bar, 100 μm.
(B and C) High-power images of N-cad-CreERT; R26-tdT; Col2.3-GFP mice shown at 6 (B) and 14 h (C) post-TMX. Hollow arrows denote Tom+Col2.3GFP+ osteoblasts (yellow); solid arrows indicate that N-cad recombined in TB (i, ii, iv, v) and CB (iii, vi) (red) and cells potentially undifferentiated (Col2.3-GFP−). Scale bar, 50 μm.
(D and E) Image quantification of percentage of Tom+Col2.3-GFP+ and Tom+Col2.3-GFP− cells in TB (D) and CB (E) at indicated time post-TMX (n = 2).
(F) Image quantification of potentially undifferentiated Tom+Col2.3-GFP− cells in TB and CB (n = 2).
(G) Representative images of TB and CB in N-cad-CreERT; R26-tdT; Col2.3-GFP mice at 4 weeks post-TMX. Scale bar, 20 μm.
(H) Representative images of femur section in N-cad-CreERT; R26-tdT mice with Perilipin staining in periosteal region (i), TB (ii), and CM (iii) (arrows) at 4 weeks post-TMX.
(I) BODIPY staining showed the adiposome (green) inside the Tom+ Perilipin+ adipocyte (arrows). Scale bar, 20 μm.
(J and K) Image quantification of Tom+Perilipin+ adipocytes in TB (J) and periosteal region (K) at 6, 14, and 24 h and 2 and 4 weeks post-TMX (n = 2). *p < 0.05, **p < 0.01, ***p < 0.001. Error bars, SEM.

