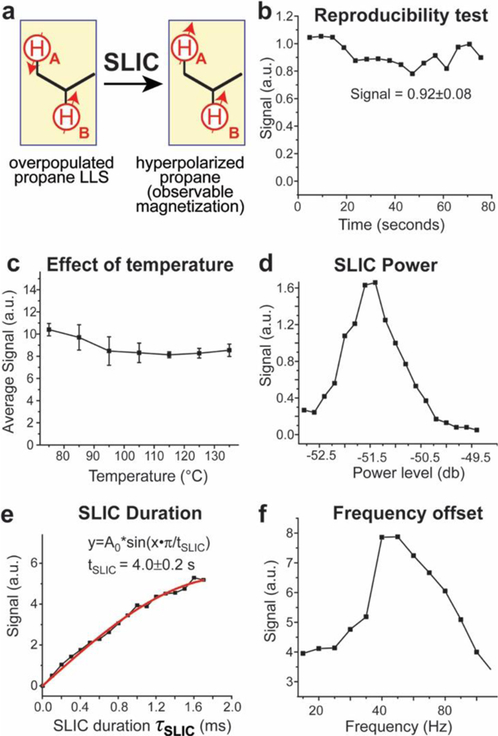
Figure 3.

Results from SLIC pulse optimization with HP propane data acquired using the 0.0475 T NMR spectrometer setup shown in Scheme 1 at production/reactor/reaction temperature of 60 ± 1 °C (except for display c) where the temperature was varied). a) Diagram showing the transformation of LLS of HP propane (denoted schematically as a singlet) into observable magnetization achieved using a SLIC pulse. b) Results from a test of the shot-to-shot reproducibility of the intensity of the HP propane signal. c) Temperature dependence of the average (over three data points) HP propane SLIC-induced signal using a 1:1 gas mixture of pH2 and propylene. d) Optimization of RF power of the SLIC pulse (note the x-axis is provided in db units of the Kea NMR spectrometer due to the non-linearity of the RF amplifier at low power levels; the maximum is expected at B1 RF strength between 10 Hz and 30 Hz63). e) The dependence of the HP propane signal on the SLIC pulse duration (experimental data: black points; a fit using a sinusoidal function is shown by the solid red curve). f) The dependence of the HP propane signal on the SLIC pulse frequency offset (the solid lines are added to guide the eye). Note a SLIC pulse duration of 500 ms was employed for the data acquisition in panels b), c), d), and f). Connecting lines in displays b), c), d), and f) are meant only to guide the eye.
