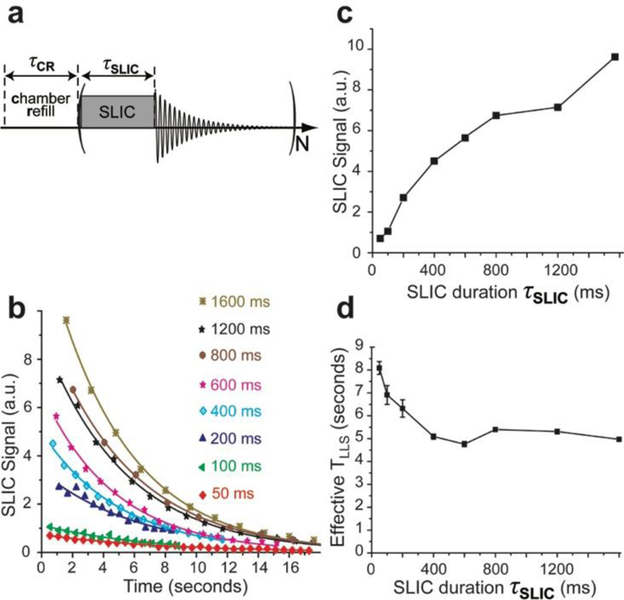
Figure 6.

a) Pulse sequence comprising a series of partial SLIC pulses with variable duration each followed by NMR signal acquisition; note the sequence is repeated N times on a single batch of static HP propane gas. b) The decay of HP propane signals obtained using the partial SLIC excitation scheme (with variable SLIC duration); note the color coding of the SLIC pulse duration in the figure legend (see Table S1 for additional details). c) The intensity of the first data point in display b) plotted as a function of the SLIC pulse duration. Connecting lines in displays c) and d) are meant only to guide the eye.
