Abstract
The combined effort of several laboratories at our institution resulted in the building of the first high resolution PET/CT prototype dedicated to imaging the body extremities. Ongoing clinical trials for breast cancer diagnosis and assessment of response to treatment underlined the need for a second generation prototype with improved electronics and spatial resolution. A preliminary version has been assembled and fully characterized. In this work we present further improvements in the detector performance as well as the readout electronics for the PET component. The detector consists of a 16×16 array of 1.27×1.27×20mm3 LYSO crystals, the smallest crystal size for completed breast PET prototypes to date, directly coupled to a position-sensitive photomultiplier tube (PSPMT). The scintillator crystals are polished on all 6 faces and separated by ~70 μm ESR reflector. The readout electronics were redesigned to reduce their footprint and improve timing resolution. We report a detector energy and timing resolution of 12% and 1.0 ns, respectively, and an average intrinsic spatial resolution of 1.29 mm (central row in one detector array). The new PET/CT has been fully assembled and initial system characterization is being perfomed. We report a system energy resolution of 15.7%, a timing resolution of 1.5 ns and an FBP image spatial resolution in the center of the FOV of 1.6 mm.
1. Introduction
Whole-body (WB) PET/CT is routinely used in the breast cancer management for staging and restaging of advanced disease, as well as for the evaluation of tumor response to treatment (Groheux et al. 2013). As far as management of local disease is concerned, WB PET/CT is only used to provide additional information in cases where other imaging modalities are not sufficient for a clear diagnosis (Rosen et al. 2007). One reason is the limited spatial resolution and sensitivity of WB PET/CT, which makes it an inadequate tool for breast cancer diagnosis, where nonpalpable, small (≤ 1.0 cm) malignancies have to be detected.
Since the mid-nineties, PET camera designs specific for breast imaging were proposed and commercialized. We can divide these scanners into two broad categories based on their design and type of data produced. The first category encompasses devices that provide only a limited angular sampling, resulting in anisotropic spatial resolution, that are often referred to as Positron Emission Mammography (PEM) (Thompson et al. 1995, Abreu et al. 2006, MacDonald et al. 2009). In PEM, the breast is imaged under mild compression and two detector heads are generally used. Overall, the design and acquisition geometry is very similar to a conventional mammographic unit, with the patient seated and upright during the scan.
On the other side, dedicated breast PET scanners provide fully tomographic information, either by encircling the breast with PET detectors (Furuta et al. 2010, Moliner et al. 2012, Ravindranath et al. 2012) or by rotating two or more heads around the breast (Wu et al. 2009, Raylman et al. 2011, Albuquerque et al. 2009). These scanners are sometimes referred to as breast PET (bPET). The UC Davis bPET/CT scanner (Wu et al. 2009) that we developed, referred to as Davis bPET/CT (DbPET/CT) is a dual planar head PET system combined with a flat panel breast CT scanner developed by Dr. John Boone at our institution (Boone et al. 2010). 20 patients were imaged in different clinical trials using this system (Bowen et al. 2009, Ferrero et al. 2011b).
Clinical trials conducted at our institution to assess the potential of dedicated PET/CT for assessment of response to treatment in breast cancer (Ferrero et al. 2011b) and rheumathoid arthritis in the hand (Chaudhari et al. 2011) underlined the need for further improvements in spatial resolution as well as a larger transaxial field of view (FOV) of the scanner in order to accomodate larger breasts. We have proposed several designs for future prototypes, with different degrees of complexity and expected performance. These designs include partial and full-ring systems as well as a zoom-in insert to be used for local enhancement of spatial resolution (Agarwal et al. 2013).
A second generation dedicated breast PET prototype with improved detector performance, dubbed DbPET2.0, was recently fully characterized (Ferrero et al. 2011c, Ferrero et al. 2014). Since then we have upgraded the scintillation detector as well as the readout electronics for further improvements in their performance prior to its integration with a new breast CT prototype. In this work, we present a complete detector characterization of these new detectors including energy, timing and spatial resolution, as well as a preliminary performance evaluation of the assembled prototype, hereinafter referred to as DbPET2.1.
2. Materials and Methods
Detector Module
Each module consists of a 16×16 array of polished Cerium-doped Lutetium Yttrium Orthosilicate (LYSO) crystals (Crystal Photonics, Inc., Sanford, FL) read out by a Hamamatsu C12 position-sensitive photomultiplier tube (PSPMT). Crystal size is 1.27 × 1.27 × 20 mm3, the smallest in use in fully characterized breast PET scanners to date. The use of polished crystal, combined with the use of a specular reflector (ESR), allows for optimal light collection efficiency at the expense of loss in Depth-of-Interaction (DOI) information, which however is not supported by this particular detector design.
New electronics stacks were designed and built that optimize the amplification stage to interface with a commercial electronics suite (Siemens Cardinal) used for clinical and preclinical PET cameras. As the geometry of dedicated breast PET scanners tend to make them more susceptible to the detection of randoms events, particular attention was paid to the optimization of the timing performance to enable us to use shorter coincidence timing windows. Additionally, the new stacks are more compact to help reduce the gaps between detectors in the assembled system.
System electronics
The Siemens/CTI Cardinal electronics (Siemens Medical Solutions, Knoxville, TN) are used in the DbPET 2.1. The system electronics consists of two assemblies of the readout electronics, a coincidence processor, and a host PC. Each electronic assembly has 64 analog readout channels and serves 16 detector modules. The 64 analog readout channels in each electronic assembly are divided into two groups. The firmware of the field-programmable gate arrays (FPGA) in the electronic assemblies was modified to read the four analog inputs from the PSPMT, eliminate the baseline, calculate the single event energies, decode the crystal locations and record the event timings in real time. As shown in Figure 1, 16 samples of each shaped PMT pulse (sampling frequency: 40 MHz) are summed to estimate the deposited energy in the scintillator and to calculate the x and y locations of the events in the flood histogram. The system software and firmware were modified to accomodate the larger look-up tables required by the detectors with 16 × 16 discrete crystals. The events with energies that fall within given windows, which are preset by the host PC software for each individual crystal, are sent to the coincidence processor. The coincidence processor detects valid coincidence events between both electronic assemblies and sends list mode data to the host PC through an optical fiber cable.
Figure 1. Diagram of the front-end FPGA firmware to process the input pulses from the PS-PMT and generate valid single event data for coincidence detection.
PET scanner design
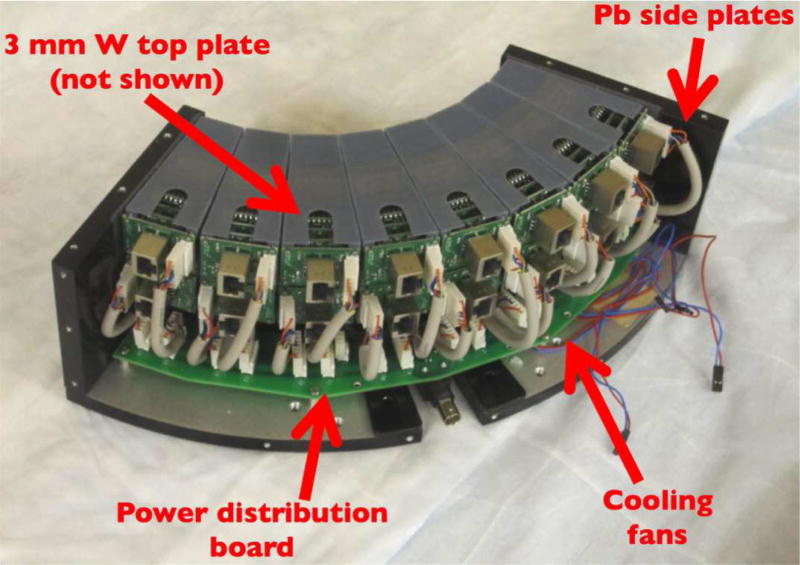
DbPET 2.1 has two heads in coincidence, each of them consisting of 16 detectors arranged in a circular 2×8 configuration, spanning exactly 90 degrees. The ring diameter is 247.4 mm, resulting in a transaxial FOV of 175 mm. The axial FOV is 50 mm. Each PET detector was placed inside a 3D printed holder (Objet Polyjet by Stratasys, Ltd), with accurate and reproducible positioning ensured by a three-point connection to the aluminum base plate. A custom-made distribution board was designed to provide both the high and low voltage lines to each detector. The heat produced by the electronics stacks is dissipated by 4 small fans placed below the detectors.
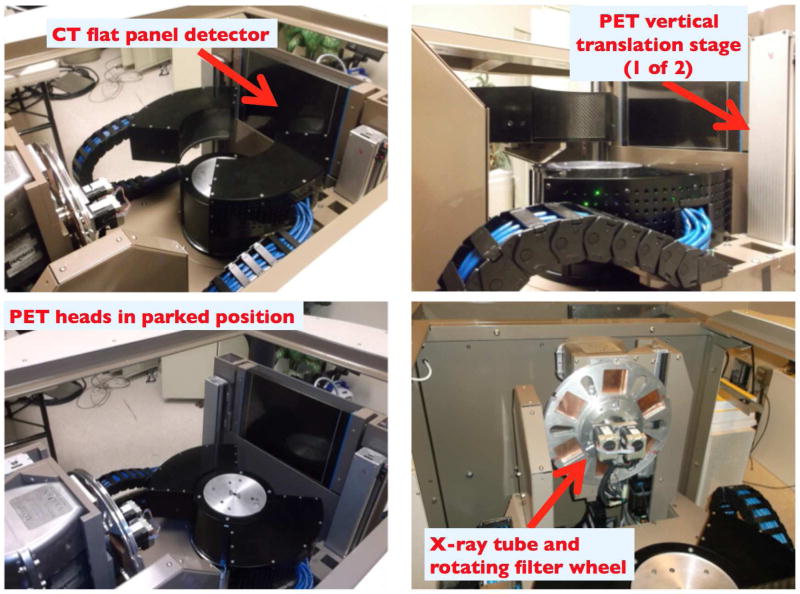
Lead plates on the sides and 3 mm of tungsten on the top provide shielding from x-rays as well as annihilation photons from the patient torso. During a CT scan, the front faces of the detectors are shielded from scattered x-rays by 3 mm of lead lining the center post. Vertical stages are used to independently position the PET heads close to the chest wall and to cover the whole axial extent of the breast. The whole PET/CT gantry rotates together to provide fully tomographic data.
In Figure 2 a picture of one assembled PET head with the top plate removed is shown. In Figure 3 we show different views of the assembled PET/CT gantry. The CT performance was separately assessed (Gazi et al. 2015).
Figure 2. One of the two assembled PET heads.
Figure 3. Composite view of the assembled PET/CT gantry from different angles.
A 35ft long cable pathway is used to send signals form the PSPMT’s to the Cardinal electronics. In order to ease system assembly each pathway is split into two cables and are interconnected using female-female RJ45 connectors. In order to deal with dynamic cable management, IGUS energy chain (IGUS Inc, East providence, R.I.), is used.
Validation of PET heads alignment
A high resolution rotating PET scanner is particularly prone to artifacts arising from a misalignment between the focal axis of the scanner, defined as the line in space that has equal distance from all detector elements in a given ring, and the axis of rotation of the gantry. For a sub-mm resolution system, misalignments of few hundred micrometers may result in artifacts in the images as well as degraded spatial resolution. Although these artifacts may be corrected by developing a center of rotation correction, its implementation only partially compensates for the loss in spatial resolution and complicates the data correction schemes required for quantitatively accurate images. Therefore, proper physical alignment between the focal axis of the PET detectors and the axis of rotation is desirable. While conventional machining is reasonably accurate, having some flexibility for small adjustments in detector head alignment serves as a way to address the tolerance stack-up issue associated with a complex system.
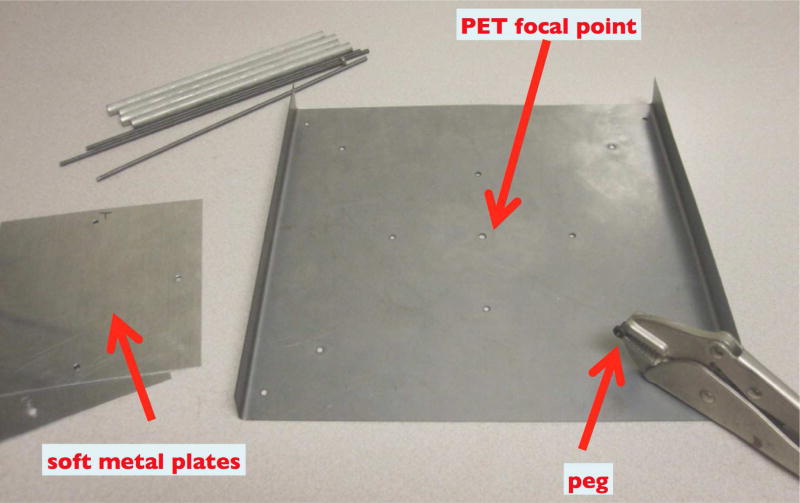
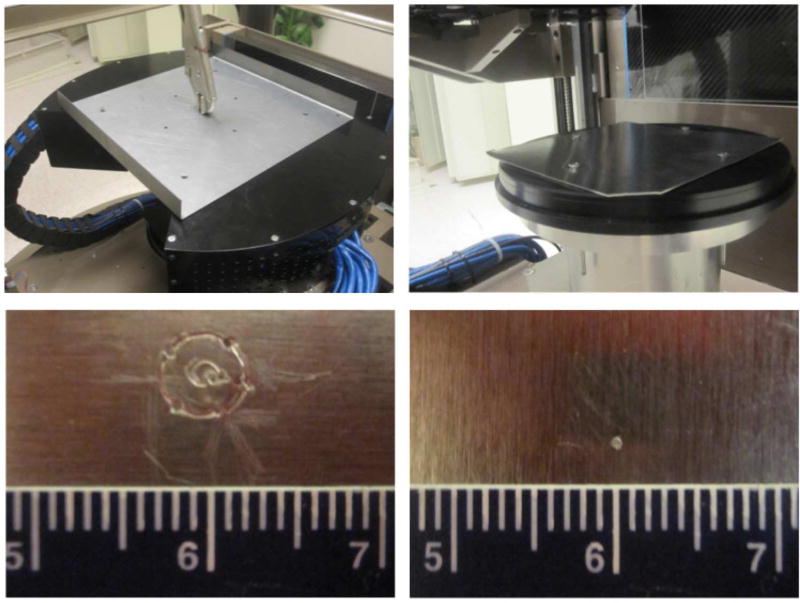
We have developed a method that allows accurate and reproducible positioning of the two PET heads in DbPET/CT 2.1. A positioning plate is used. The plate has holes that allows for rigid registration of the heads which ensure their concentricity. The plate has a hole that lies at the radial center of the two head. A small peg is inserted in the central hole and the heads are lowered until the peg is in contact with a soft metal sheet positioned on the center post of the gantry. If the tip of the peg is at the center of rotation of the gantry, it will not move during the gantry rotation and only a point will be inscribed on the metal. However, if the tip is not at the center of rotation, it will inscribe a circle whose diameter and direction are indicators of the magnitude of the misalignment. By repeating this measurement and adjusting the position of the PET heads accordingly by using slots in the mounting plates, one can progressively improve on the accuracy of the PET heads alignment with respect to the axis of rotation of the gantry. In Figure 4 the material used for the alignment procedure is shown. The procedure was repeated at the top and at the bottom of the axial FOV of the scanner.
Figure 4. Equipment for aligning the PET heads to the axis of rotation of the gantry.
Reproducibility of vertical position
Two vertical ball screw assemblies each composed of a stepper motor with 1 μm step size (MDrive 23 Plus, Schneider Electric, Vacaville, CA) coupled to a ball screw drive with gear ratio of 4.8 (Nippon Bearing Co., Fremont, CA) enable the PET heads translation along the axis perpendicular to the gantry rotation plane.. In order to validate the accuracy of the vertical positioning and its reproducibility for dynamic imaging, a sensitivity profile to annihilation events was measured with a point source located at the center of the FOV and translated in the vertical direction with 0.1 mm increments. Tomographic data was acquired at each step and the sinograms processed according to NEMA NU 4-2008 specifications (NEMA 2008). 800 steps were aquired covering a total distance of 8 cm. Two consecutive measurements were taken and the generated profiles were overlapped. The distance of each local maximum and minimum in the sensitivity profile was measured and used as a metric to determine the accuracy and reproducibility of the position of the PET detectors in the vertical direction.
Performance characterization
Energy, timing and intrinsic spatial resolution measurements (average plus standard deviation, SD, or range) for two detectors in coincidence were all performed with conventional Nuclear Instrumentation Module (NIM) equipment. The timing resolution was measured using a time to amplitude converter and the output of the CFDs for the two detectors as start and stop triggers, respectively. Once the system was fully assembled, singles and coincidence data from the Cardinal electronics were acquired to determine the system energy, timing and image spatial resolution. The axial spatial resolution is affected by the acquisition protocol used to cover the FOV - for instance when a helical trajectory is used - and is the object of a separate investigation.
3. Results
Detector Characterization
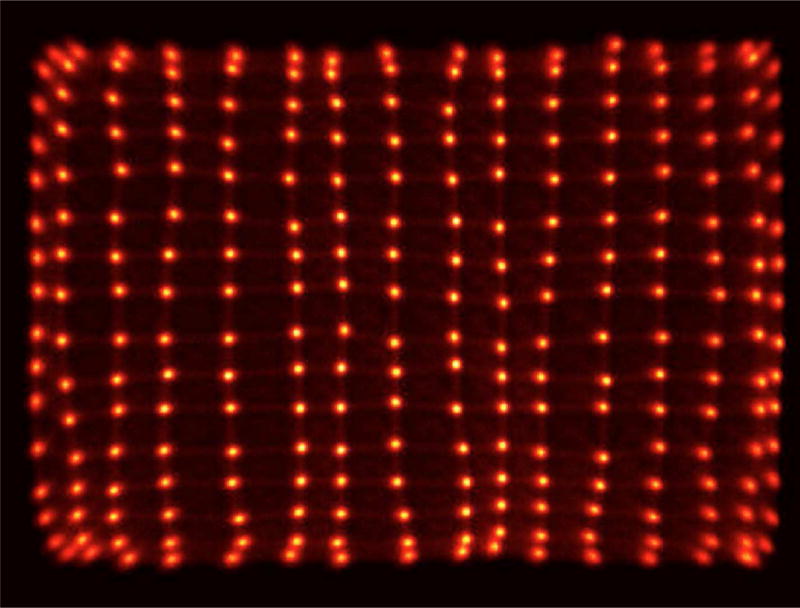
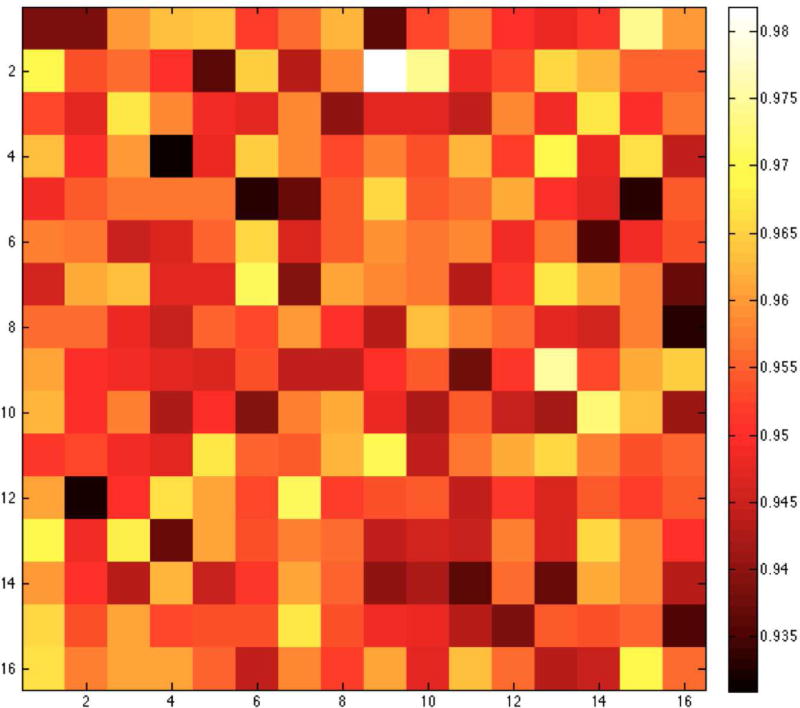
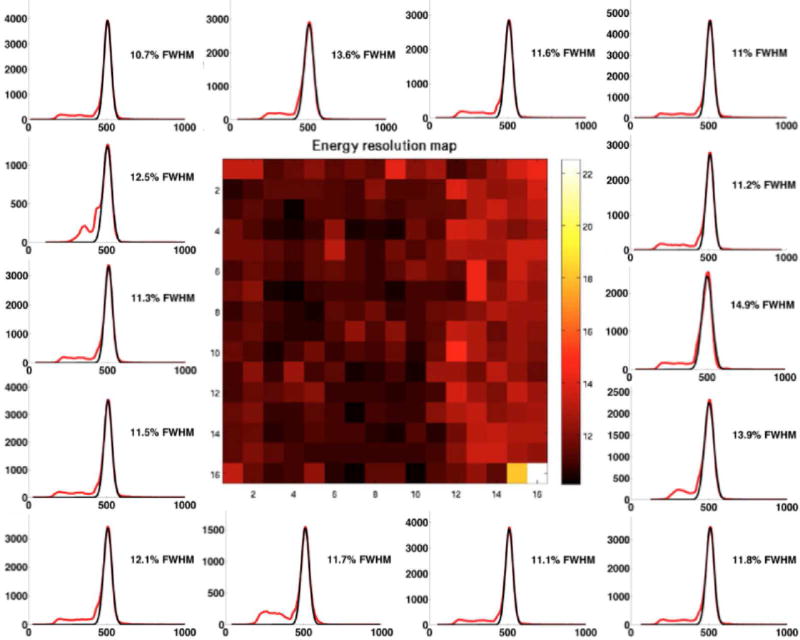
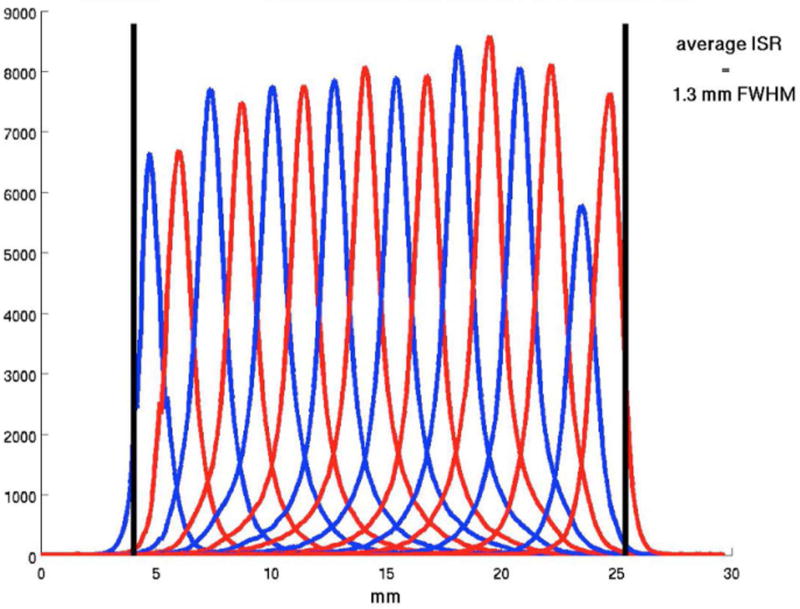
In Figure 5 we show a sample flood histogram for the new detector. All crystals can be identified although the corner crystals are not very easily separated from their neighbors. We report an average timing resolution of 0.95 ns (SD 0.009 ns), an average energy resolution with front-face irradiation of 11.97% (SD 1.33%) and an intrinsic spatial resolution (averaged over a central row of the detector module) of 1.29 mm (range 1.25–1.43 mm). In Fig. 6 and 7 a crystal-by-crystal map of timing and energy resolution for a representative detector are shown, respectively. In Figure 8 a histogram of the intrinsic spatial resolution for each individual crystal in a central row are shown.
Figure 5. Flood histogram for the DbPET2.1 detector.
Figure 6. Crystal-by crystal timing resolution map for the DbPET2.1 detector.
Figure 7. Crystal-by crystal energy resolution map for the DbPET2.1 detector.
Energy spectra (red) for representative crystals are shown together with the corresponding Gaussian fit (black).
Figure 8. Intrinsic spatial resolution over a central row for the DbPET2.1 detector.
Each curve is a histogram of the coincidence events detected by a line-of-response normal to the two detectors as a function of the absolute position of the poinst source.
Validation of PET heads alignment
In Figure 9 the alignment procedure is shown (top) together with a close-up of the inscribed plates at the beginning of the alignment procedure (bottom left) and after the final iteration (bottom right). In Figure 10 the sinogram for a point source acquired before and after the PET heads aligment is shown.
Figure 9. PET heads concentricity before (bottom left) and after (bottom right) performing the aligment procedure shown in the top row.
This process improved the geometric accuracy of the system by approximately 2mm.
Figure 10. Sinogram of a point source before (left) and after (right) aligning the heads.
Reproducibility of vertical position
In Figure 11 the three sensitivity profiles are overlapped to one another. The maximum absolute error between the local maxima and minima of the two profiles is 0.1 mm, which proves the excellent accuracy of our vertical positioning.
Figure 11. Two consecutive measurements of the sensitivity profiles used to estimate the vertical repositioning accuracy of the PET detectors.
System Performance
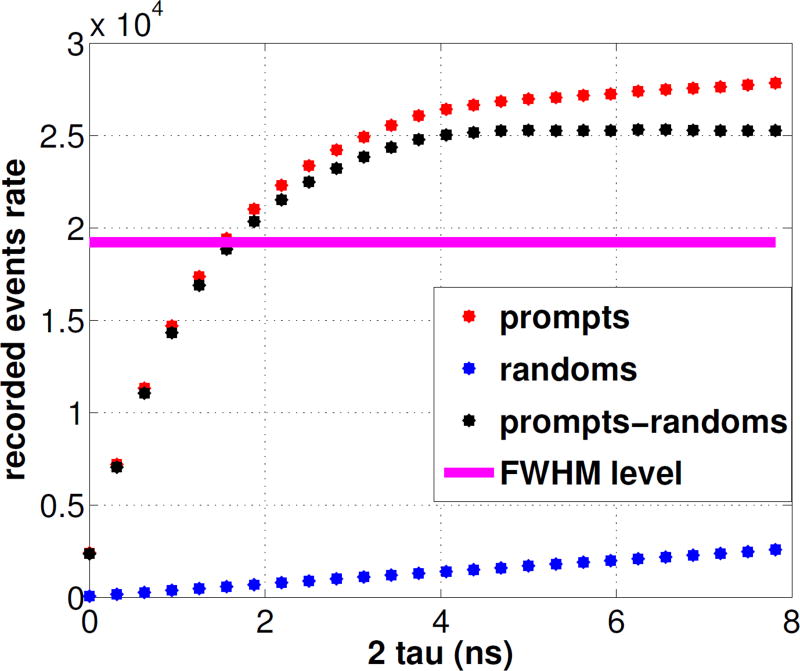
In Figures 12 we show the count rates as a function of coincidence timing window. The 78% value - which corresponds to the Full Width at Half Maximum of the (prompts-randoms) counts measured with an open window - intersects the true coincidence curve at 1.5 ns. The average energy resolution for all modules in the final configuration was 15.7%. 2D Filtered Back-Projection (FBP) following single slice rebinning (SSRB) for a point source located near the center of the field of view resulted in a reconstructed transaxial image spatial resolution of 1.6 mm. In Table 1 we report a comparison between the specifications of the three different breast PET prototypes built at our institution to date.
Figure 12. Coincidence rates for varying coincidence timing window.
Table 1. Initial performance comparison between the three prototypes.
| DbPET | DbPET 2.0 | DbPET 2.1 | |
|---|---|---|---|
| Scintillator | LSO, polished | LSO, unpolished | LYSO, polished |
| Reflector | Teflon | Toray (65μm) | ESR (70μm) |
| Crystal pitch (mm) | 3.3 | 1.55 | 1.34 |
| Array size (mm3) | 30×30×20 | 22×22×20 | 21.5×21.5×20 |
| Crystals per module | 81 (9×9) | 196 (14×14) | 256 (16×16) |
| Modules per head | 16 (4×4) | 16 (2×8) | 16 (2×8) |
| Head-to-Head distance (mm) | 263 | 260 | 247.5 |
| Transaxial FOV (mm) | 119 | 182 | 175 |
| Axial FOV (mm) | 119 | 53 | 50 |
| Intrinsic spatial resolution (mm) | 2.2 | 1.26 | 1.29 |
| Detector energy resolution (NIM) (%) | 25 | 25.7 | 12.0 |
| Detector timing resolution (ns) | 3 | 2.4 | 1.0 |
| System energy resolution (%) | 25 | / | 15.7 |
| System timing resolution (ns) | 6 | / | 1.5 |
| FBP Image spatial resolution (mm) | 3.3 | 1.7 | 1.6 |
| Peak Sensitivity (%) | 1.6 | / | 0.5 |
4. Discussion and Conclusions
The PET heads aligmnent to the axis of rotation is a critical step to ensure the best spatial resolution of the system is achieved. A design that allows small (~1 mm) adjustments in the relative positioning of the two heads is recommended because the stack-up of tolerances that is typical of a complex design makes it challenging to ensure correct aligmnent, as it was the case for our system.
As expected with PMT detectors, the timing resolution is very consistent over all crystals (see Fig. 6) and therefore does not require crystal-by-crystal calibration.
The system-level energy and timing resolution are degraded over the performance achieved with NIM modules for a single detector. Causes for such degradation include the longer cables used in the energy chain of the assembled PET/CT gantry as well as the sampling rate of the Cardinal electronics. The measured values of timing and energy resolution for the whole system are equivalent to or better than any breast PET/CT currently under clinical evaluation (Iima et al. 2012, Moliner et al. 2012).
The intrinsic spatial resolution for DbPET2.1 is not better than that of DbPET2.0, despite the smaller crystals employed. Possible explanations include the different material used (LYSO vs. LSO) and manufacturing techniques used to assemble the two arrays. The reconstructed spatial resolution is slightly better for the final scanner, possibly owing to the more accurate positioning of the detectors in the gantry as well as reduced gaps and a slightly smaller ring diameter.
The preliminary results for reconstructed spatial resolution are similar to or better than state-of-the-art breast PET scanners like the commercially available MAMMI (Oncovision) (Moliner et al. 2012) and Shimadzu (Shimadzu Corp) (Miyake et al. 2014) systems, although the sensitivity is undoubtedly worse. A summary of system performance between those three breast systems is provided in Table 2 for reference. Our lab is addressing the sensitivity issue with a full-ring design that will also have depth-encoding detectors. A full NEMA spatial resolution assessment with point sources at several location as well as system modelling is under way.
Table 2. System performance characteristichs for three bPET scanners.
| Shimadzu bPET (Iima et al. 2012) (Miyake et al. 2014) |
Oncovision MAMMI PET (Moliner et al. 2012) |
DbPET/CT 2.1 | |
|---|---|---|---|
| Transaxial FOV (mm) | 183 | 170 | 175 |
| Axial FOV (mm) | 155.5 | 40 | 50 |
| System energy resolution (%) | 16.9 | >18 | 15.7 |
| System timing resolution (ns) | 1.2 | / | 1.5 |
| FBP spatial resolution (mm) - cFOV | 1.6 | >2 | 1.6 |
| Peak Sensitivity (%) | 11.2 | 1.6 | 0.5 |
| DOI capability | yes | yes | no |
| CT component | no | no | yes |
The assembled gantry is capable of producing fully tomographic CT data in 8s, and fully tomographic PET data in as little as 20s for the entire breast with an helical acquisition protocol, thus opening up the possibility for high resolution, dynamic breast PET/CT imaging. A full performance evaluation for both the PET and the CT component is underway.
Acknowledgments
The authors would like to thank Julien Bec for assistance with the mechanical design of the detector modules, Dr. Peymon Gazi for assistance with the development of the PET/CT acquisition software and Dr. Emilie Roncali for editing the manuscript. The UC Davis breast PET/CT prototype is funded by the NIH grants R01CA129561 and R01EB002138, as well as by the Susan G. Komen for the Cure foundation (grant BCT40707455). Andrea Ferrero is funded by an Howard Hughes Medical Institute fellowship for international predoctoral students.
References
- Abreu M, Aguiar J, Almeida F, Almeida P, Bento P, Carrico B, Ferreira M, Ferreira N, Goncalves F, Leong C, et al. Nuclear Science, IEEE Transactions on. 2006;53(1):71–77. [Google Scholar]
- Agarwal S, Zhou J, Sumanasena B, Ferrero A, Qi J, Badawi RD, Chaudhari AJ. World Molecular Imaging Congress; Savannah, GA, USA. 2013. (Oral presentation) [Google Scholar]
- Albuquerque E, Almeida F, Almeida P, Auffray E, Barbosa J, Bastos A, Bexiga V, Bugalho R, Cardoso C, Carmona S, et al. Nuclear Science Symposium Conference Record (NSS/MIC), 2009 IEEE. IEEE; 2009. pp. 3487–3490. [Google Scholar]
- Boone J, Yang K, Burkett G, Packard N, Huang S, Bowen S, Badawi R, Lindfors K. Technology in cancer research & treatment. 2010;9(1):29. doi: 10.1177/153303461000900104. [DOI] [PMC free article] [PubMed] [Google Scholar]
- Bowen S, Wu Y, Chaudhari A, Fu L, Packard N, Burkett G, Yang K, Lindfors K, Shelton D, Hagge R, et al. Journal of Nuclear Medicine. 2009;50(9):1401. doi: 10.2967/jnumed.109.064428. [DOI] [PMC free article] [PubMed] [Google Scholar]
- Chaudhari AJ, Ferrero A, Godinez F, Yang K, Boone JM, Buonocore MH, Hunter JC, Shelton DK, Hagge R, Falen SW, et al. ARTHRITIS AND RHEUMATISM. Vol. 63. WILEY-BLACKWELL COMMERCE PLACE; 350 MAIN ST, MALDEN 02148, MA USA: 2011. pp. S76–S76. [Google Scholar]
- Ferrero A, Chaudhari A, Bowen S, Yang K, Lindfors K, Boone J, Martines S, Badawi R. JOURNAL OF NUCLEAR MEDICINE. Vol. 52. SOC NUCLEAR MEDICINE INC; 1850 SAMUEL MORSE DR, RESTON, VA 20190-5316 USA: 2011b. pp. 661–661. [Google Scholar]
- Ferrero A, Peng Q, Godinez F, Chaudhari A, Vu C, Choong WS, Moses W, Badawi R. Nuclear Science Symposium and Medical Imaging Conference (NSS/MIC), 2011 IEEE. IEEE; 2011c. pp. 3256–3259. [Google Scholar]
- Ferrero A, Peng Q, Zhou J, Burkett G, Bec J, Gazi P, Sumanasema M, Godinez F, Boone J, Badawi R. Society of Nuclear Medicine Annual Meeting Abstracts. Vol. 55. Soc Nuclear Med; 2014. p. 2144. [Google Scholar]
- Furuta M, Kitamura K, Ohi J, Tonami H, Yamada Y, Furumiya T, Satoh M, Tsuda T, Nakazawa M, Hashizume N, et al. Nuclear Science Symposium Conference Record (NSS/MIC), 2009 IEEE. IEEE; 2010. pp. 2548–2552. [Google Scholar]
- Gazi PM, Yang K, Burkett GW, Jr, Aminololama-Shakeri S, Seibert JA, Boone JM. Medical physics. 2015;42(4):1973–1981. doi: 10.1118/1.4915079. [DOI] [PMC free article] [PubMed] [Google Scholar]
- Groheux D, Espié M, Giacchetti S, Hindié E. Radiology. 2013;266(2):388–405. doi: 10.1148/radiol.12110853. [DOI] [PubMed] [Google Scholar]
- Iima M, Nakamoto Y, Kanao S, Sugie T, Ueno T, Kawada M, Mikami Y, Toi M, Togashi K. Journal of Nuclear Medicine. 2012;53(10):1534–1542. doi: 10.2967/jnumed.111.100958. [DOI] [PubMed] [Google Scholar]
- MacDonald L, Edwards J, Lewellen T, Haseley D, Rogers J, Kinahan P. Journal of Nuclear Medicine. 2009;50(10):1666. doi: 10.2967/jnumed.109.064345. [DOI] [PMC free article] [PubMed] [Google Scholar]
- Miyake KK, Matsumoto K, Inoue M, Nakamoto Y, Kanao S, Oishi T, Kawase S, Kitamura K, Yamakawa Y, Akazawa A, et al. Journal of Nuclear Medicine. 2014;55(7):1198–1203. doi: 10.2967/jnumed.113.131565. [DOI] [PubMed] [Google Scholar]
- Moliner L, González A, Soriano A, Sánchez F, Correcher C, Orero A, Carles M, Vidal L, Barberá J, Caballero L, et al. Medical physics. 2012;39(9):5393–5404. doi: 10.1118/1.4742850. [DOI] [PubMed] [Google Scholar]
- NEMA. Performance measurements of positron emission tomographs for dedicated small animal scanners. Washington: National Electric manufacturer Association; 2008. Report NU 4-2008. [Google Scholar]
- Ravindranath B, Huang PJ, Junnarkar S, Hong X, Purschke M, Maramraju SH, Wang GJ, Vaska P, Woody C, Schlyer D. Society of Nuclear Medicine Annual Meeting Abstract. Vol. 53. Soc Nuclear Med; 2012. p. 1217. [Google Scholar]
- Raylman RR, Abraham J, Hazard H, Koren C, Filburn S, Schreiman JS, Kurian S, Majewski S, Marano GD. Journal of medical imaging and radiation oncology. 2011;55(1):58–64. doi: 10.1111/j.1754-9485.2010.02230.x. [DOI] [PMC free article] [PubMed] [Google Scholar]
- Rosen E, Eubank W, Mankoff D. Radiographics. 2007;27(suppl 1):S215. doi: 10.1148/rg.27si075517. [DOI] [PubMed] [Google Scholar]
- Thompson C, Murthy K, Picard Y, Weinberg I, Mako F. IEEE Transaction on Nuclear Science. 1995;42(4):1012–1017. [Google Scholar]
- Wu Y, Bowen S, Yang K, Packard N, Fu L, Burkett G, Qi J, Boone J, Cherry S, Badawi R. Physics in Medicine and Biology. 2009;54:4273–4287. doi: 10.1088/0031-9155/54/13/020. [DOI] [PMC free article] [PubMed] [Google Scholar]


