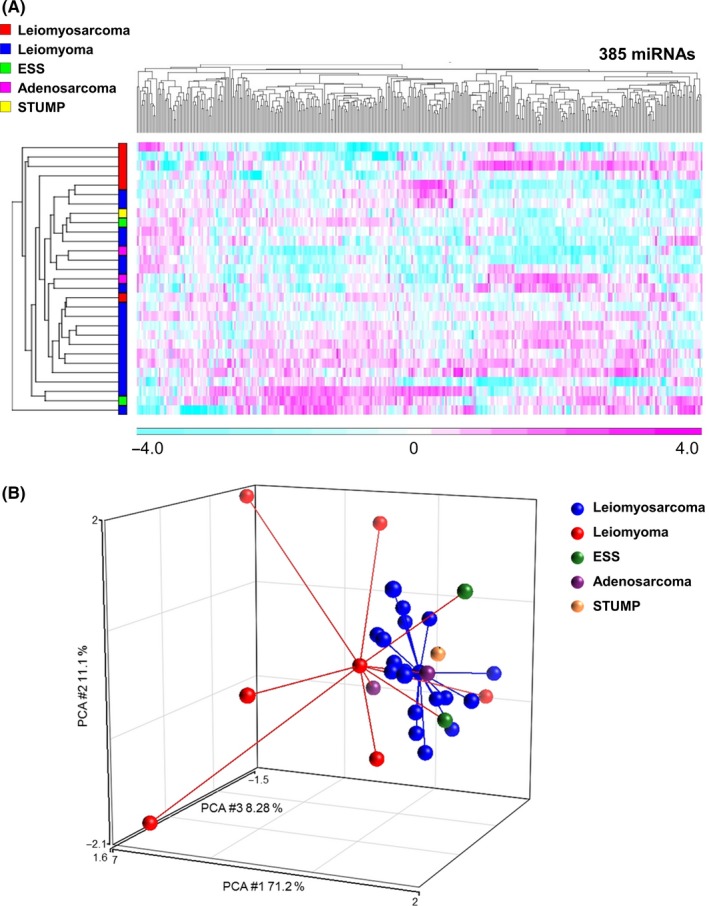
Figure 2.

MicroRNA profiles for whole samples. A, Heat map of serum miRNA expression of patients with uterine tumors. For miRNA expression analysis, a one‐way analysis of variance was performed to identify differentially expressed miRNAs (P < .05), resulting in selection of 385 miRNAs. Unsupervised clustering and heat map generation were performed on sorted datasets by Pearson's correlation according to Ward's method using probe sets selected by Partek Genomics Suite 6.6. N = ULMS, 6; ULM, 18; ESS, 2; adenosarcoma, 2; STUMP, 1. B, Principal component analysis mapping for serum miRNA expression of patients with uterine tumors. N = ULMS, 6; ULM, 18; ESS, 2; adenosarcoma, 2; STUMP, 1
