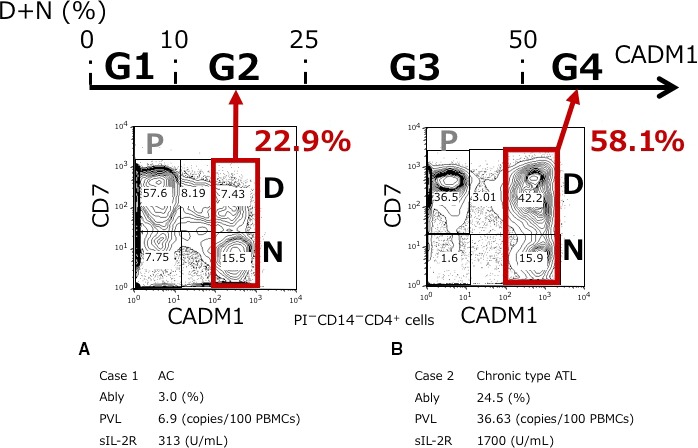
Figure 1.

Classification based on the percentage of CADM1+ cells among the CD4+ cells according to a CADM1 versus CD7 plot. The CADM1 versus CD7 plot in CD4+ cells and clinical data of two representative cases are shown. The P (CADM1−CD7+), D (CADM1+CD7dim), and N (CADM1+CD7−) subpopulations were gated as described in our previous report. Cases were classified based on the percentage of CADM1+ (D + N) cells as follows: G1, D + N ≤ 10%; G2, 10% < D + N ≤ 25%; G3, 25% < D + N ≤ 50%; and G4, 50% < D + N. A, Case 1. D + N = 22.9%, which was classified as G2. B, Case 2. D + N = 58.1%, which was classified as G4. Ably, abnormal lymphocytes; AC, asymptomatic carrier; ATL, adult T‐cell leukemia/lymphoma; CADM1, cell adhesion molecule 1; PBMC, peripheral blood mononuclear cells; PVL, proviral load; sIL‐2R, soluble interleukin‐2 receptor
