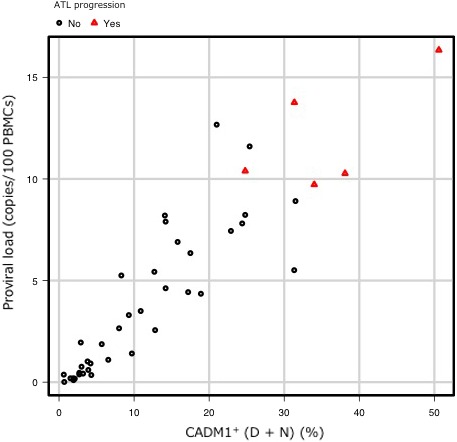
Figure 5.

Scatter plot of the HTLV‐1 proviral load (PVL) versus the percentage of CADM1+ cells from the CADM1 versus CD7 plot. Scatter plot of the PVL versus the percentage of CADM1+ cells from the CADM1 versus CD7 plot in asymptomatic carrier (AC) cases with (red triangles) or without (black circles) progression to indolent adult T‐cell leukemia/lymphoma (ATL)
