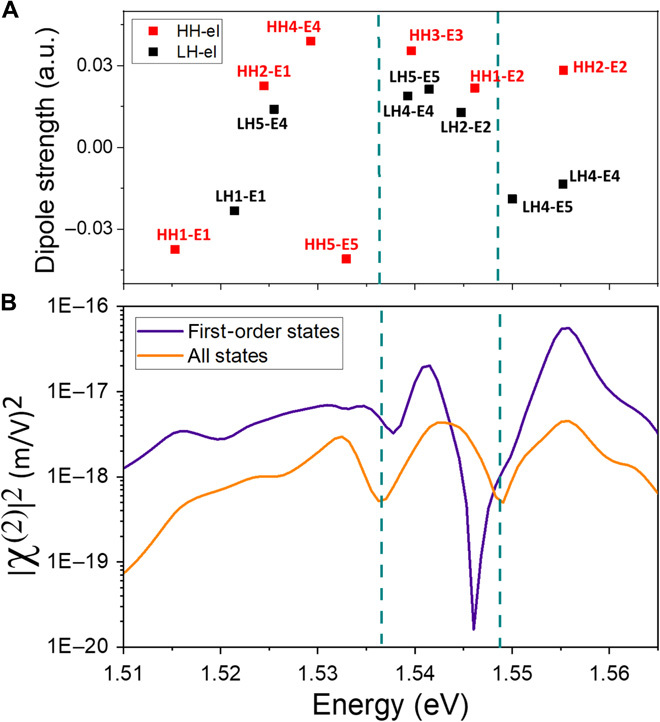
Fig. 5. Susceptibility minima origins.

(A) Interband dipole strength of both HH-el (red) and LH-el (black) transitions [only dipoles with absolute strength >0.01 arbitrary units (a.u.) are shown]. (B) Modulus squared |χ(2)|2 calculated in reflection geometry for both HH-el and LH-el transitions, taking into account all states (orange curve) and only the first-order confined states (purple curve). Minima previously discussed are indicated by green dashed lines.
