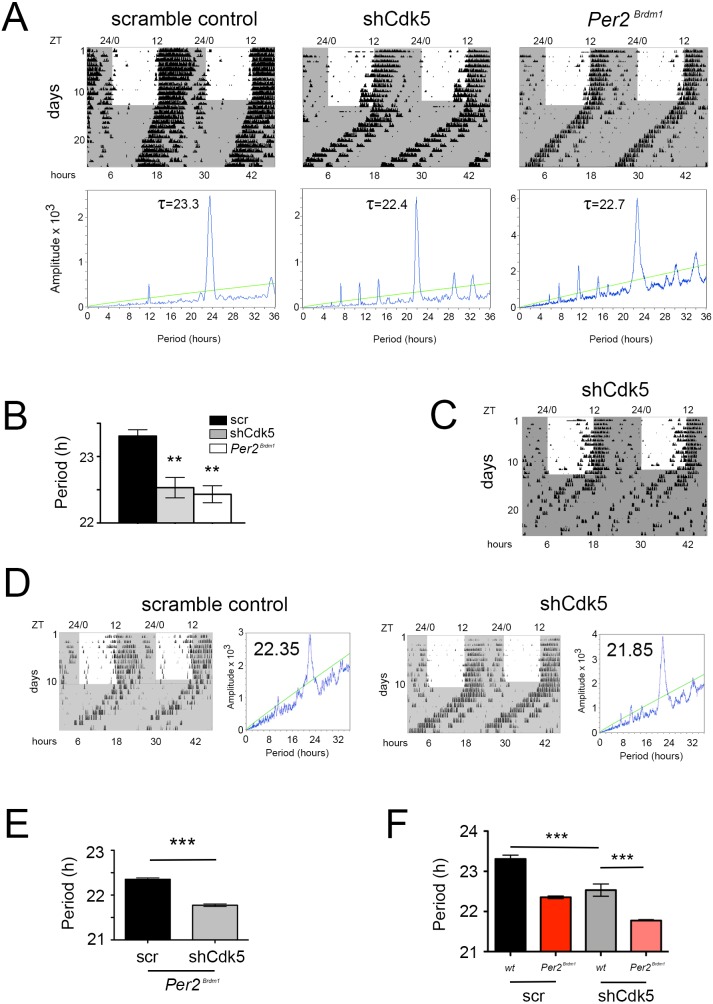
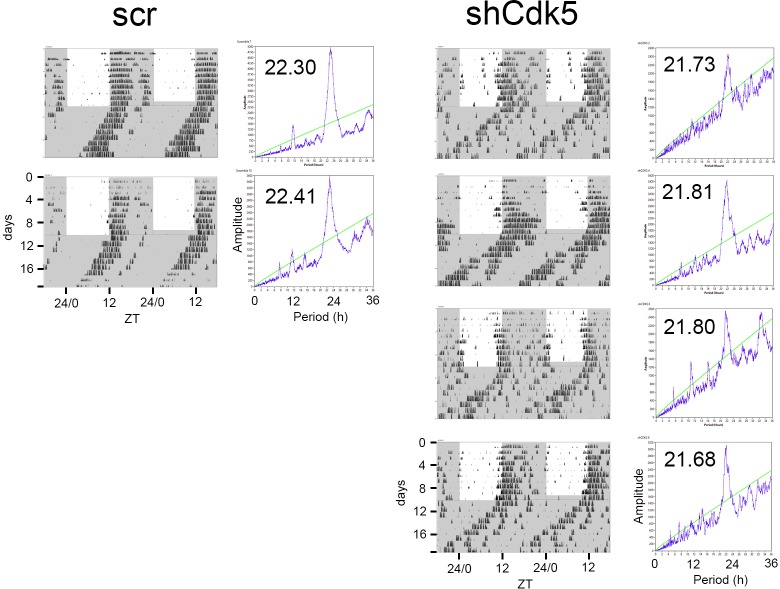
Figure 2. CDK5 affects the circadian clock.
(A) Wheel-running activity of mice (black bins) infected with AAV expressing scrambled control shRNA, or shCdk5, and an animal with a deletion in the Per2 gene (Per2Brdm1). The actograms are double plotted displaying in one row and below 2 consecutive days. The locomotor activity was confined to the dark period (shaded in gray), while under LD the mice displayed low activity during the light phase (white area). Under DD (continuous gray shaded area) the shCdk5 and Per2Brdm1 animals show earlier onset of activity each day compared with the control animals. The χ2-periodogram analysis for each of the animals is shown below the corresponding actogram to determine the period length (τ). (B) Quantification of the circadian period: 23.3 ± 0.1 hr for the control mice (n = 6, black bar), 22.5 ± 0.2 hr for shCdk5 injected mice (n = 6, gray bar), and 22.4 ± 0.1 hr for Per2Brdm1 mice (n = 4, white bar), (mean ± SEM). One-way ANOVA with Bonferroni’s post-test, **p<0.01. (C) In some cases, mice in which Cdk5 was silenced in the SCN became arrhythmic. (D) Wheel-running activity (black bins) of Per2Brdm1 mice infected with AAV expressing scrambled control shRNA (scr), or shRNA against Cdk5 (shCdk5). The actograms are double plotted displaying in one row and below 2 consecutive days. The dark shaded area indicates darkness during which the free-running period was determined. To the right of each actogram the corresponding χ2-periodogram is shown. The number in each periodogram indicates the period of the animal. (E) Quantification of the circadian period: 22.35 ± 0.03 hr for the scrambled Per2Brdm1 (n = 3, black bar) and 21.77 ± 0.03 hr for the shCdk5 injected Per2Brdm1 mice (n = 5, gray bar). Values are the mean ± SEM, t-test, ***p<0.0001. (F) 1-way ANOVA test on wild-type and Per2Brdm1 animals infected with AAV expressing scrambled control shRNA (scr), or shRNA against Cdk5 (shCdk5). N = 3–6 animals, error bars are the mean ± SEM, Bonferroni multiple comparisons test, ***p<0.001.
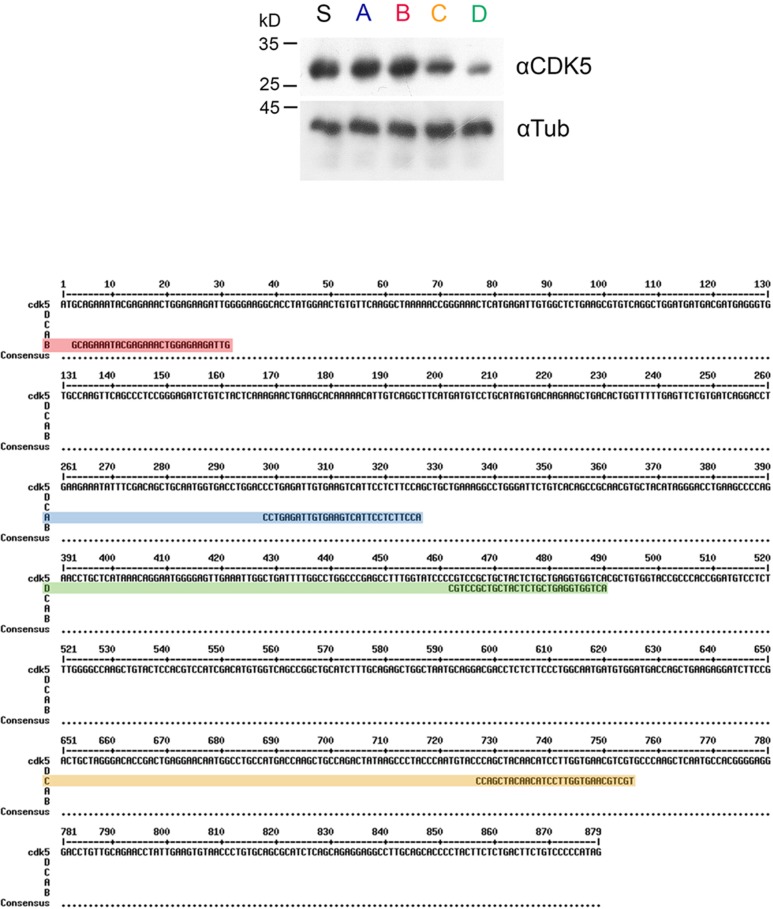
Figure 2—figure supplement 1. Characterization of shRNA against Cdk5 Western blot using NIH 3T3 cell extracts transfected with different shRNAs against Cdk5.
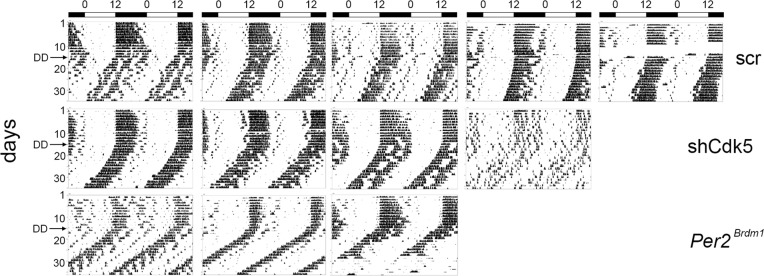
Figure 2—figure supplement 2. Additional activity plots of wild-type mice infected with AAV.
Figure 2—figure supplement 3. Activity counts per day.
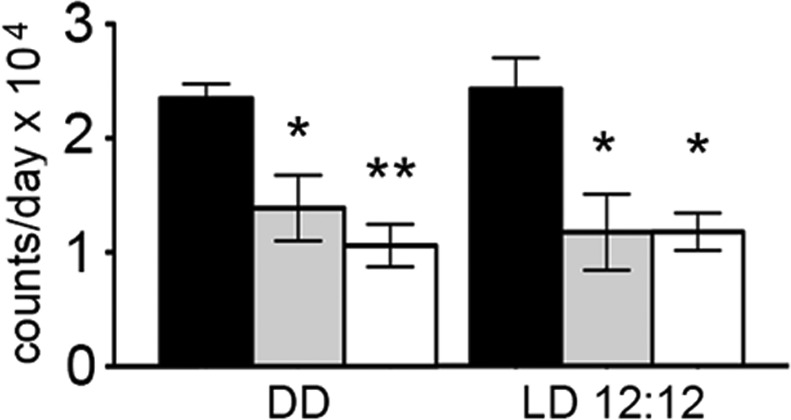
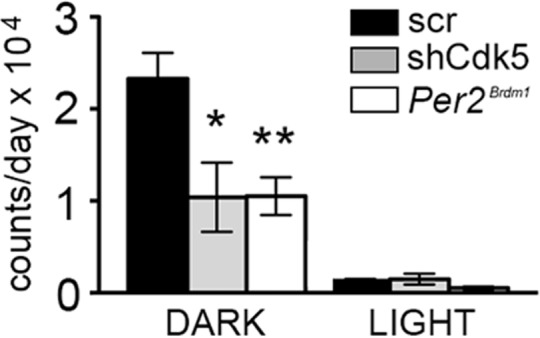
Figure 2—figure supplement 4. Activity counts in dark or light phase.
