. 2019 Nov 5;8:e50925. doi: 10.7554/eLife.50925

Figure 3. Immunohistochemistry in the SCN of control and shCdk5 silenced wild type and Per2Brdm1 mice.

(A) Representative sections of the SCN region after injection of AAVs carrying either scrambled shRNA, or shCdk5. Slices were stained with DAPI (blue), or anti-GFP (green) and anti-CDK5 (red) antibodies. GFP was used as marker for those cells infected by the virus. CDK5 was efficiently down-regulated in the SCN by shCdk5 (red panels) but not by scrambled shRNA, which was as efficiently delivered as shCDK5. As control, the non-infected piriform cortex from the same animal in which Cdk5 was silenced is shown. Scale bar: 200 µm. (B) Analysis of PER2 expression in sections of the SCN of scrambled shRNA, shCdk5 and Per2Brdm1 mice. Silencing of Cdk5 leads to lack of PER2 (red) compared with control at ZT12, which almost resembles the situation observed in Per2Brdm1 animals. Blue color: DAPI staining for cell nuclei. Scale bar: 200 µm.

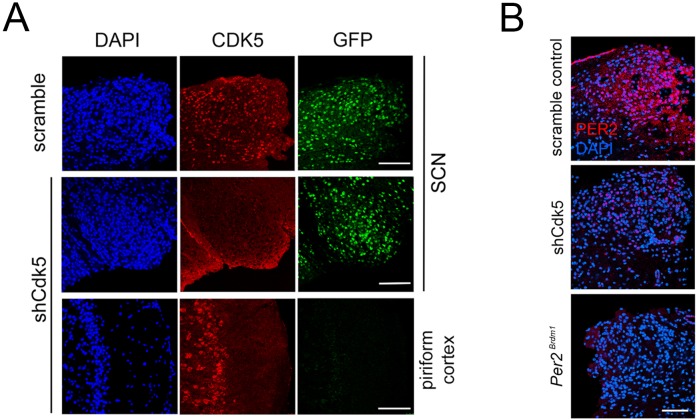
Figure 3.

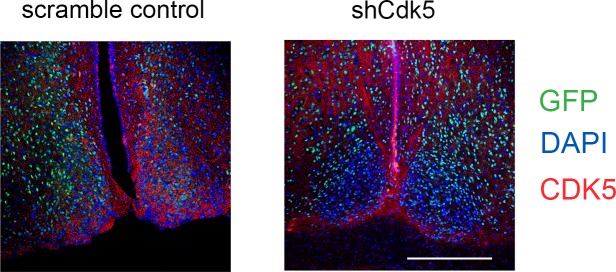
Figure 3—figure supplement 1. Lower magnification of SCN sections stained for CDK5.

Figure 3—figure supplement 1.

Representative brain sections of normal mice containing the SCN region after injection of AAVs carrying either scrambled shRNA or shCdk5. GFP was used as a marker to illustrate the infected region including the SCN. The CDK5 signal (red) is down regulated in the SCN region of AAV shCdk5 injected brain. Scale bar 500 µm.
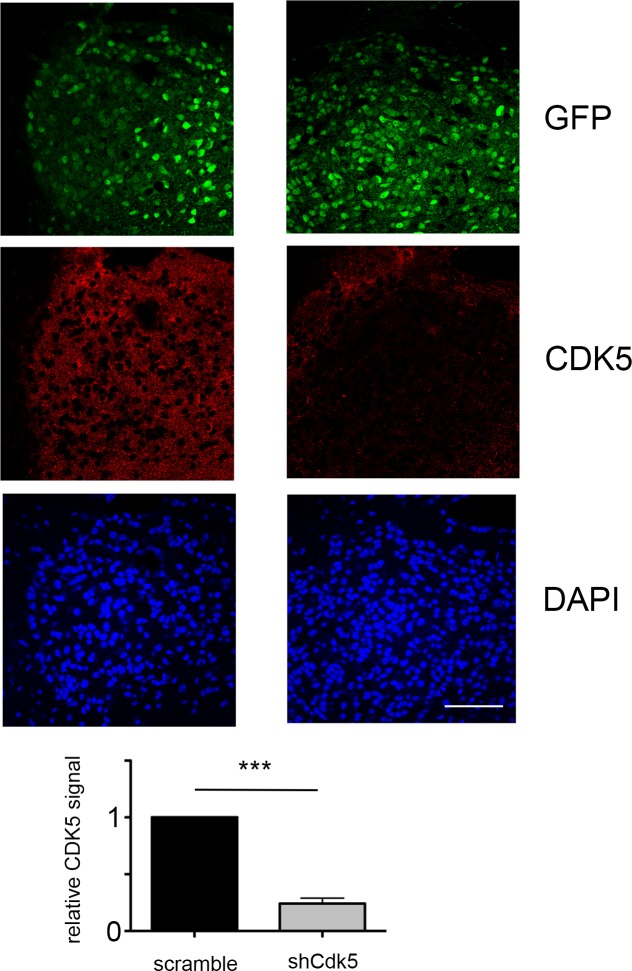
Figure 3—figure supplement 2. Quantification of CDK5 signal.

Figure 3—figure supplement 2.

Higher magnification of representative sections of the SCN after AAVs carrying either scrambled shRNA (left column) or shCdk5 (right column). CDK5 if significantly down regulated in brain infected with AAVs expressing shCdk5. Values in the bar diagram represent the mean ± SEM of CDK5 signal relative to the signal in the scramble control, t-test, n = 3, ***p<0.001. Scale bar: 60 µm.
Figure 3—figure supplement 3. Lower magnification of SCN sections stained for PER2.

Figure 3—figure supplement 3.

Representative brain sections of normal mice containing the SCN region after injection of AAVs carrying either scrambled shRNA or shCdk5. GFP was used as a marker to illustrate the infected region including the SCN. As control a SCN section of Per2Brdm1 mouse is shown that was not infected with AAV. The PER2 signal (red) is down regulated in the SCN region of AAV shCdk5 injected brain as it was absent in the Per2Brdm1 SCN. Scale bar 500 µm.
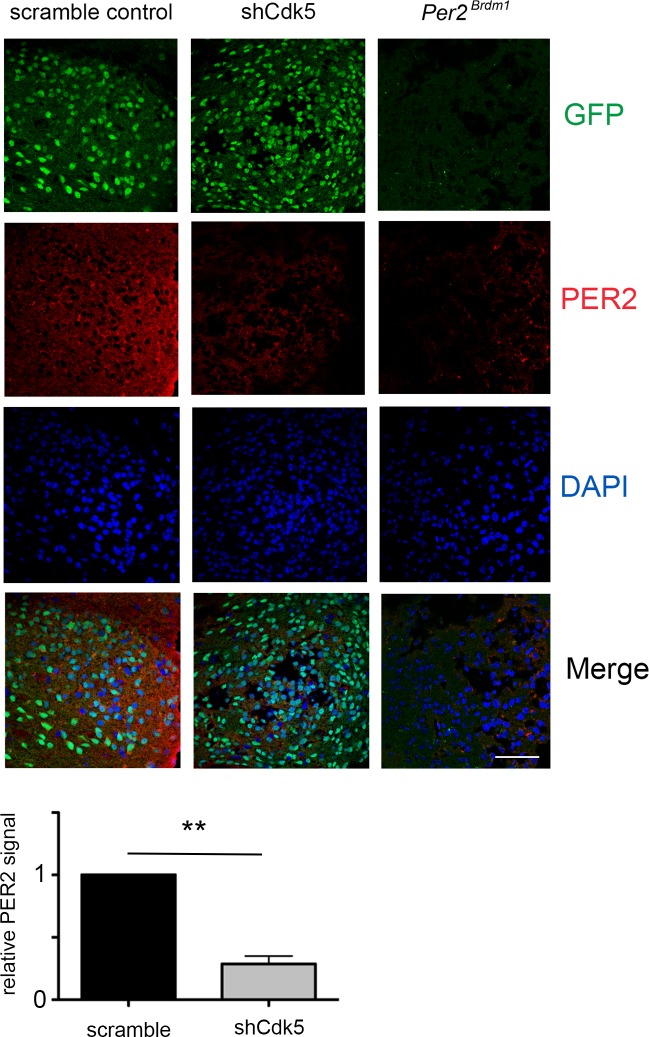
Figure 3—figure supplement 4. Quantification of PER2 signal.

Figure 3—figure supplement 4.

Higher magnification of representative sections of the SCN after AAVs carrying either scrambled shRNA (left column) or shCdk5 (middle column). CDK5 is significantly down regulated in brain infected with AAVs expressing shCdk5. The right column shows a section of Per2Brdm1 mouse not infected with AAVs. Values in the bar diagram represent the mean ± SEM of PER2 signal relative to the signal in the scramble control, t-test, n = 3, **p<0.01. Scale bar: 60 µm.