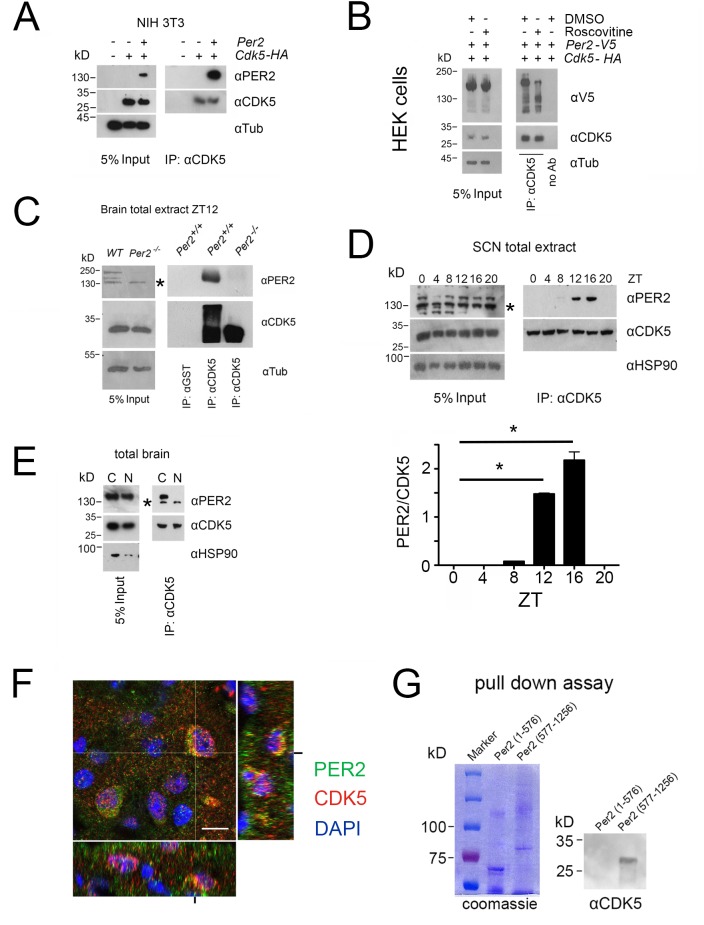
Figure 4. PER2 interacts with CDK5 in a temporal fashion in the cytoplasm.
(A) Overexpression of PER2 and CDK5-HA in NIH 3T3 cells and subsequent immunoprecipitation (IP) using an anti-CDK5 antibody. The left panel shows 5% of the input and the right panel co-precipitation of PER2 with CDK5. (B) Overexpression of PER2-V5 and CDK5-HA in HEK293 cells in presence or absence of 34 μM roscovitine (CDK5 inhibitor) and DMSO (solvent). Left panel shows 5% of the input and the right panel the immunoprecipitation with anti-CDK5 or without antibody. (C) Immunoprecipitation (IP) of PER2 and CDK5 from total mouse brain extract collected at ZT12. Left panel shows the input. The right panel depicts co-immunoprecipitation of PER2 and CDK5 using either anti-CDK5 antibody or anti-GST antibody for precipitation. The middle lane shows PER2-CDK5 co-immunoprecipitation in control animals (Per2+/+) but not in Per2-/- mice illustrating the specificity of the PER2-CDK5 interaction. The * in the blot indicates unspecific signal. (D) Temporal profile of the PER2-CDK5 interaction in total extracts from SCN tissue around the clock. Input was analyzed by immunoblot using anti-CDK5, anti-PER2, and anti-HSP90 antibodies (left panel). CDK5 co-immunoprecipitated PER2 in a diurnal fashion with a peak between ZT12 and ZT16. The statistical analysis of the PER2/CDK5 signal around the clock is shown below (one-way ANOVA with Bonferroni’s post-test, n = 3, *p<0.0001, values are mean ± SEM). * in the blot indicates unspecific signal. (E) Immunoprecipitation of PER2 with CDK5 from cytoplasmic and nuclear brain extracts collected at ZT12. The left panel shows the input and the right panel co-IP of PER2 and CDK5, which occurs only in the cytoplasm but not in the nucleus. The smaller band detected by the anti-PER2 antibody depicts an unspecific band that is smaller than PER2. * in the blot indicates unspecific signal. (F) Slices from the SCN obtained at ZT12 were immunostained with PER2 antibody (green), CDK5 (red), and nuclei were marked with DAPI (blue). Co-localization of the two proteins results in the yellow color. Scale bar: 10 µm. The z-stacks right and below the micrograph confirm co-localization of PER2 and CDK5 (yellow). (G) Purification of the N-terminal half of PER2 (1–576) or the C-terminal half (577–1256) (left panel, coomassie). CDK5-His was pulled down by both recombinant PER2 attached to the glutathione resin, but only the C-terminal was able to retain CDK5 (immunoblot using anti-His antibody, right panel).
Figure 4—figure supplement 1. PER2-CDK5 interaction in HEK cells.
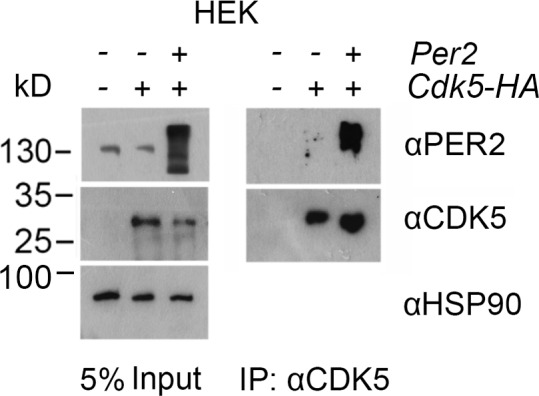
Figure 4—figure supplement 2. PER2-CDK5 interaction at different salt concentrations.
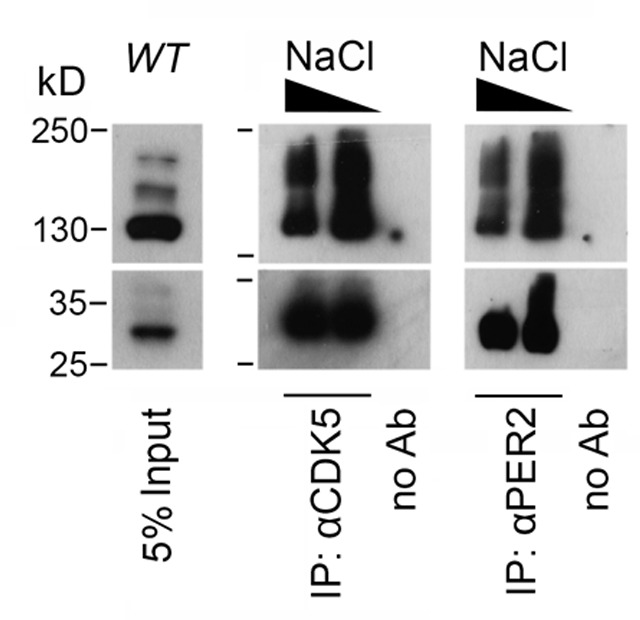
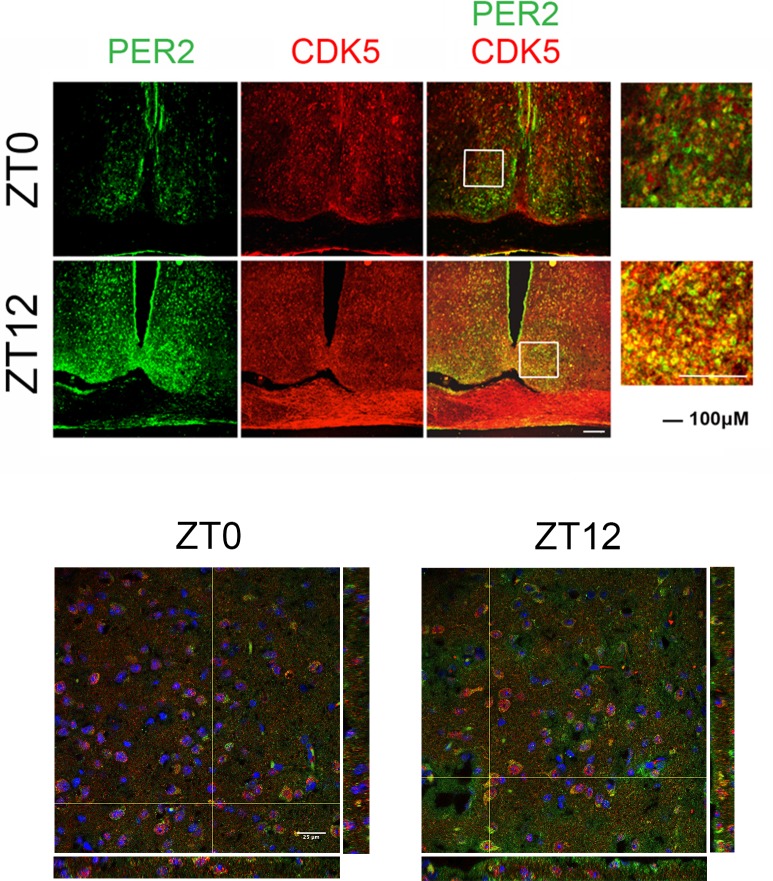
Figure 4—figure supplement 3. Co-localization of PER2 and CDK5 in SCN tissue.
Figure 4—figure supplement 4. Deletion of PAS domains had no influence on PER2-CDK5 interaction.
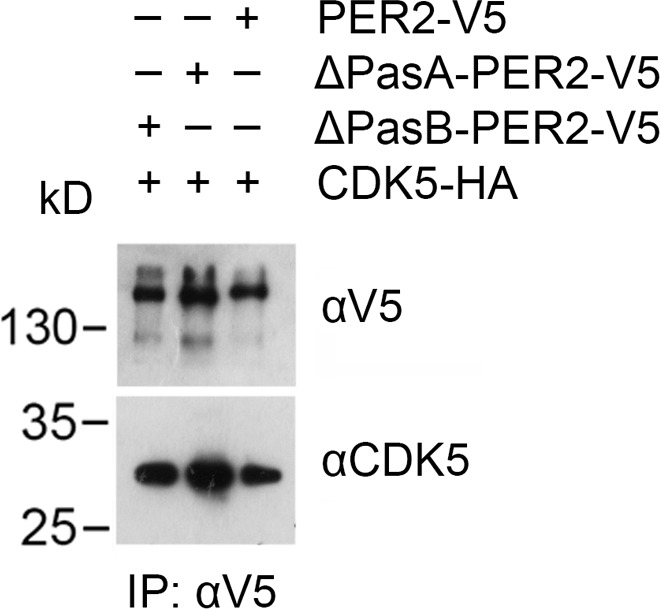
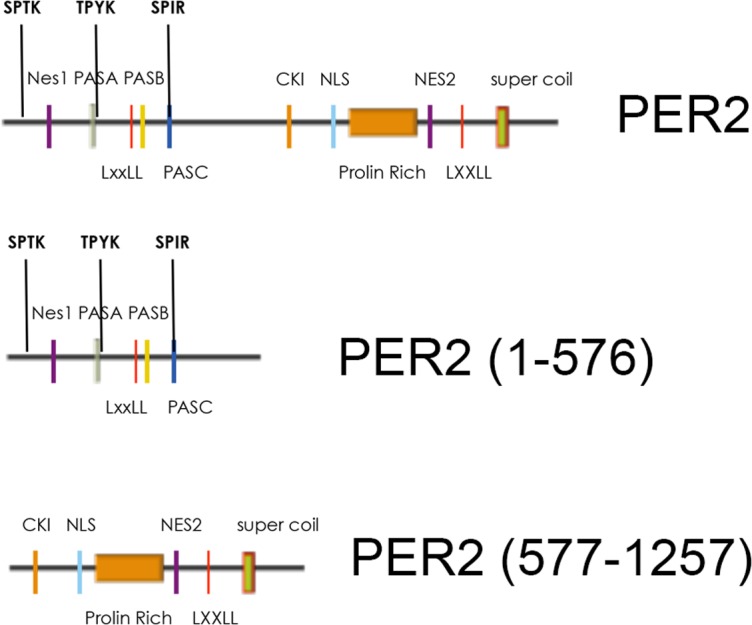
Figure 4—figure supplement 5. Scheme of PER2 fragments used for the pull-down assy.
