. 2019 Nov 19;8:e50617. doi: 10.7554/eLife.50617

Figure 7. En1/2 are required for the survival of the medial eCN and maintenance of PC numbers.

(A–F) Immunofluorescent analysis and quantification of the cerebellar area using DAPI at E15.5 (A,B) and E17.5 (C,D) showing a significant reduction in area at E17.5 (F; Student’s t-test) but not at E15.5 (E; Student’s t-test) in Atoh1-En1/2 CKOs compared to littermate controls (n = 3/condition). A slight delay in foliation was also observed at E17.5 (* base of folds). (G–N) Immunofluorescent analysis of TDTom and TUNEL on sagittal sections from a Atoh1-TDTom (G–H, K–L) and Atoh1-TDTom-En1/2 CKO (I–J, M–N) embryo showing that apoptosis is increased in the precursors of the medial and intermediate eCN of mutants at E15.5 (I–J) and at E17.5 (G–L). (O–R) Representative images of sagittal sections at the level of the intermediate CN in (S,T) stained for MEIS2 and TDTom in Atoh1-TDTom (O,P) and Atoh-TDTom-En1/2 CKOs (Q,R). (S,T) Quantification of the average number of MEIS2+ eCN cells in every second sagittal section along the medial-lateral axis at E15.5 and E17.5 in Atoh1-TDTom compared to Atoh-TDTom-En1/2 CKOs (n = 3 for each genotype) showing reduction in the medial/intermediate eCN at E17.5. eCN counts are plotted as bins of 5% percent of the mediolateral distance (E15.5: Two-way ANOVA F(1,42)=2.182, p=0.1471, E17.5: Two-way ANOVA, F(1,42)=23.67, p<0.0001). (U,V) Quantification of PCs (FOXP2+ cells, see A-D) showing reduced PC numbers in Atoh1-En1/2 CKOs compared to controls (n = 3 each genotype) at E17.5 (V) but not at E15.5 (U) (E15.5: Student’s t-test, p=0.88). Scale bars: 100 μm.

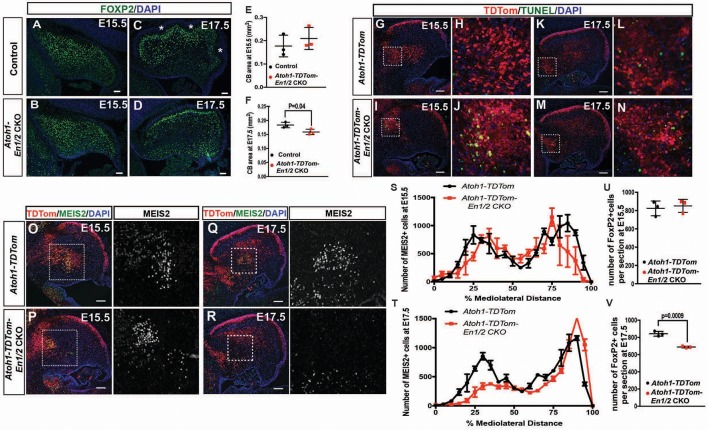
Figure 7.

Figure 7—figure supplement 1. Atoh1-Cre marks the rhombic lip lineage but not PCs.

Figure 7—figure supplement 1.

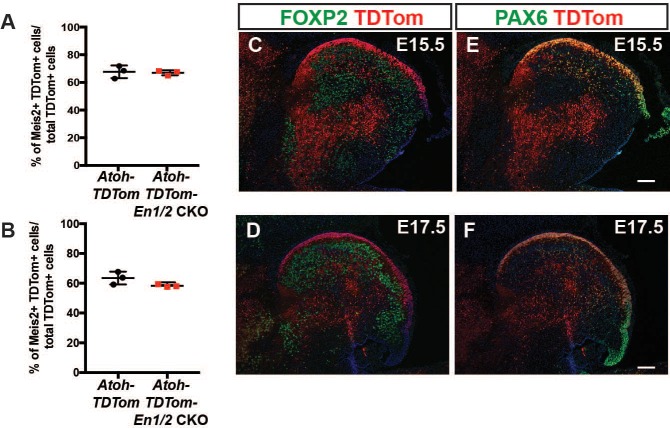
(A-B) Quantification of the percentage of Atoh1-Cre-derived cells (TDTom+) in Atoh1-TDTom mice that express MEIS2 showing no significant differences between Atoh1-En1/2 CKO mutants compared to controls at E15.5 (A) and E17.5 (B). (C-F) Immunofluorescent analysis showing TDTom+ cells (red) in the EGL and a few cells in the cortex express PAX6 (orange, granule cell lineage) at E15.5 (C) and E17.5 (D), and no TDTom+ cells express the PC maker FOXP2+ (E-F) at either age. Scale bars: 100 μm.
Figure 7—figure supplement 2. eCN in both eCN+GCP-En1/2 CKOs and eCN-En1/2 CKOs begin to die at E17.5.

Figure 7—figure supplement 2.

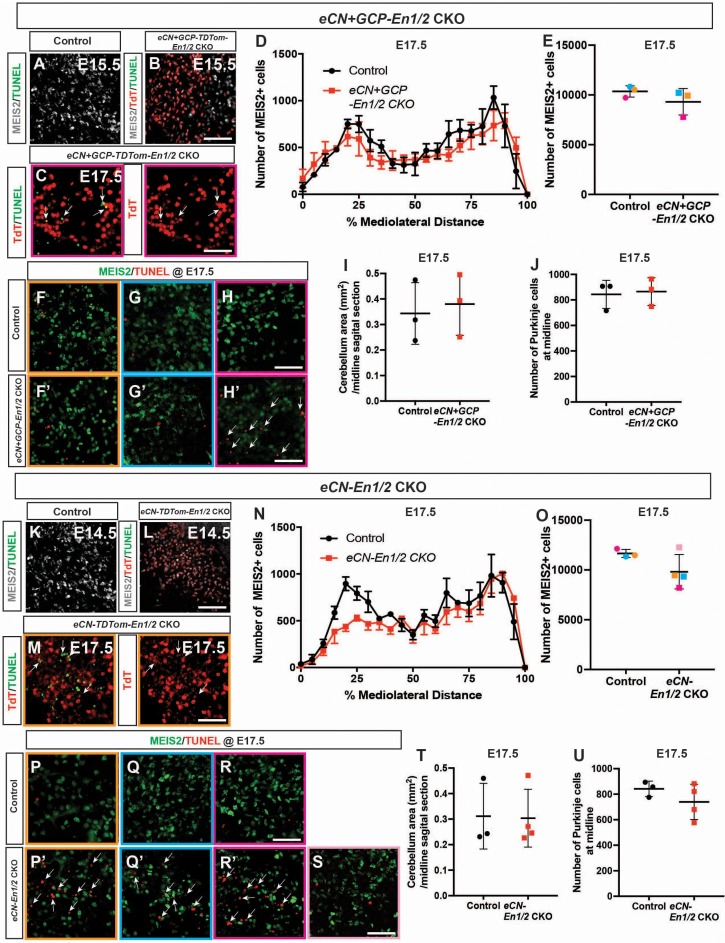
(A-C) Immunofluorescence analysis using TUNEL showing no difference in cell death between eCN+GCP-En1/2 CKOs (B) and littermate controls (A) at E15.5, however TUNEL+ TdTom+ cells are present in the medial eCN by E17.5 in one eCN+GCP-En1/2 CKO (C, same mutant as in H’). (D) Quantification of the average number of MEIS2+ eCN cells in every second sagittal section along the medial-lateral axis at E17.5 in eCN+GCP-En1/2 CKOs compared to littermate controls (n = 3 for both genotypes). eCN counts are plotted as bins of 5% percent of the mediolateral distance (Two-way ANOVA, F(1, 84)=1.62. p=0.2067). (E) Quantification of the total number of MEIS2+ cells at E17.5 in eCN+GCP-En1/2 CKOs compared to littermate controls (Student’s t-test). Littermates are represented by dots of the same color. (F-H’) Immunofluorescence analysis using TUNEL showing increased apoptosis in the medial/intermediate eCN in a mutant with a reduced eCN number (H’) compared to its littermate control (H). (I) Quantification of cerebellar area at the midline in eCN+GCP-En1/2 CKOs and littermate controls at E17.5 (Student’s t-test). (J) Quantification of FOXP2+ cells between eCN+GCP-En1/2 CKOs and littermate controls at E17.5 (Student’s t-test). (K-M) Immunofluorescence analysis using TUNEL showing no difference in cell death in eCN-En1/2 CKOs (L) compared to littermate controls (K) at E14.5, however TUNEL+ TdTom+ cells are present in the medial eCN by E17.5 in eCN-En1/2 CKOs (M, same mutant as in P’). (N) Quantification of eCN cells in every second sagittal section along the medial-lateral axis at E17.5 in eCN-En1/2 CKOs compared to littermate controls (n = 3 for controls, n = 4 for mutants) showing reduction in the medial/intermediate eCN at E17.5. eCN counts are plotted as bins of 5% percent of the mediolateral distance (Two-way ANOVA, F(1, 105)=6.27, p=0.0138). (O) Quantification of the total number of MEIS2+ cells at E17.5 in eCN-En1/2 CKOs compared to littermate controls (Student’s t-test). Littermates are represented by dots of the same color (light pink and dark pink mutants are from the same litter). (P-S) Immunofluorescence analysis using TUNEL showing increased cell death in the medial/intermediate eCN of mutants with reduced eCN numbers (P’, Q’, R’) compared to littermate controls (P, Q, R). (T) Quantification of cerebellar area at the midline at E17.5 (Student’s t-test). (U) Quantification of FOXP2+ cells at E17.5 (Student’s t-test). Arrows indicate TUNEL particles. Scale bars = 50 μm.