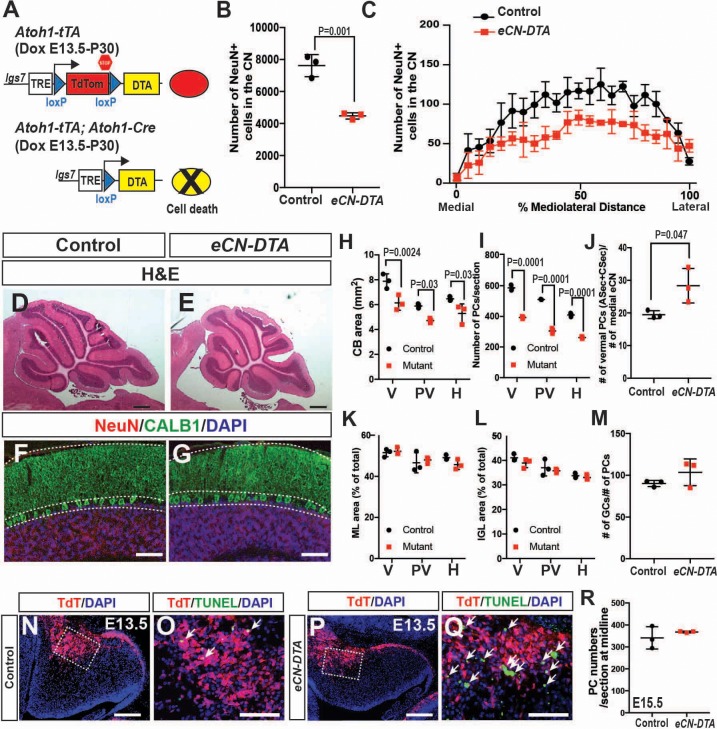
Figure 8. Genetic killing of embryonic eCN results in subsequent loss of PCs and reduced growth of the cerebellar cortex.
(A) Schematic explaining the genetics used to kill PCs in all three CN. Dox-controlled and recombinase activated gene overexpression (DRAGON) allele was used in combination with the Atoh1-tTA and Atoh1-Cre to enable embryonic killing of eCN via mis-expression of DTA (Dox given from E13.5 until sacrifice). (B) Semi-automated quantification of the large NeuN+ cells in the eCN on every second slide showing significant reduction in eCN-DTA animals at P30 compared to their littermate controls (n = 3 animals/genotype, Student’s t-test). (C) Cell loss was similar across the mediolateral axis (Two-way ANOVA, F(1,88)=52.48, p=0.0001). (D–G) H and E analysis (D,E) and immunofluorescent analysis (F,G) of PCs (CALB1+) and GCs in the IGL (NeuN+) on midsagittal sections showing reduction in cerebellar area but conserved cytoarchitecture. (H–I) Quantification of cerebellum area (H) and PC numbers (I) showing a significant reduction at all mediolateral levels at P30 in eCN-DTA animals compared to control littermates (cerebellum area: Two-way ANOVA, F(1,4)=19.47, p=0.0116, PC numbers: Two-way ANOVA, F(1,4)=38.86, p=0.0034) (V: vermis, PV: paravermis, H: hemispheres). (J) Estimated ratio of vermal ASec+CSec PCs to the medial eCN showing it is increased in the eCN-DTA animals compared to control littermates (n = 3/genotypes, Student’s t-test). (K–M) Quantification showing relative ratios of ML (K) and IGL (L) area compared to total sector area and the ratio of the number of GCs to PC (M, data quantified in the vermis) are unchanged. (N–Q) TUNEL staining for cell death showing an increase in the nuclear transitory zone at E13.5 in eCN-DTA animals compared to controls (n = 3). (R) Quantification of PC numbers (FOXP2+) at E15.5 on midsagittal sections showing that PCs are produced at a normal number in eCN-DTA animals (n = 3). Significant post hoc comparisons are shown in the figure. DTA: diphtheria toxin fragment A. Scale bars: D-E: 500 μm, F-H and N-Q 100 μm.

