. 2019 Dec 3;8:e50143. doi: 10.7554/eLife.50143

Figure 6. Individual response probabilities between different drug concentrations overlap at a population level.

(A) Individual empirically-estimated transition probability matrices are plotted in the plane spanned by P(U|U) and P(R|R) for animals exposed to 0.3% isoflurane (n = 18, blue dots) and 0.6% isoflurane (n = 20, red dots). (B) Probability density of the individual across-trial response probabilities were estimated for mice exposed to 0.3% isoflurane (blue) and 0.6% isoflurane (red). At the population level, distributions of responsiveness at the two isoflurane concentrations are significantly different (U = 54, n0.3% iso = 18, n0.6% iso = 20, p<0.001). Overlap of the two distributions was 57%. (C) Posterior distributions, representing the probability that a mouse with a given across-trial response probability was exposed to 0.3% (blue) isoflurane or 0.6% (red) isoflurane. Over a broad range of response probabilities, the odds of correctly identifying drug concentration on the basis of observed responsiveness is close to chance. Statistical significance is shown by ***p<0.001. Source data for response probability distributions described are available in the Figure 6—source data 1.

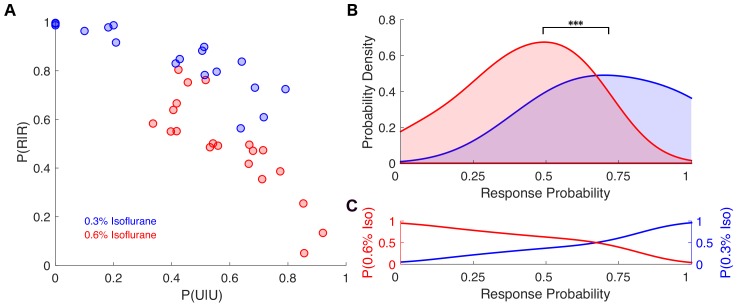
Figure 6—source data 1. PC1 values for mice exposed to 0.6% and for mice exposed to 0.3% isoflurane.

Figure 6.

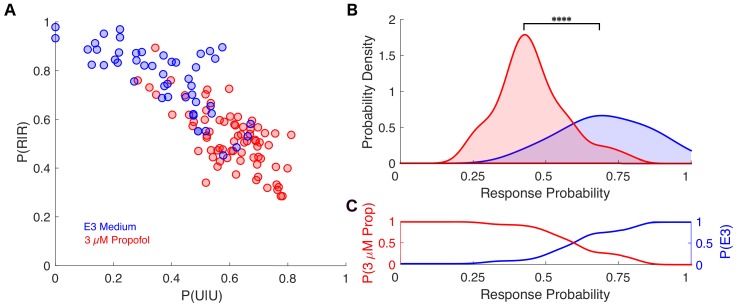
Figure 6—figure supplement 1. Individual response probabilities between different drug concentrations overlap in zebrafish.

Figure 6—figure supplement 1.

(A) Transition probability matrix estimated for each individual is represented by a point in a plane spanned by P(R|R) and P(U|U) for zebrafish exposed to either E3 medium (n=48, blue dots) or 3 μM propofol in E3 medium (n=72, red dots). (B) Probability density functions of average across-trial response probabilities were estimated for E3 alone (blue) and 3 μM propofol (red) from the projection of the transition probability matrices onto the first principal component (PC1) which accounts for ~90% of the variance among individuals. There is a significant difference between the distributions for fish exposed to E3 or 3 μM propofol (U = 324, nE3 = 48, n3μM = 72, p < 0.0001). (C) Posterior distributions computed using Bayes' theorem representing the probability of a zebrafish being exposed to either E3 (blue) or 3μM (red) propofol given the animals response probability. As in mice, over a broad range of average across-trial response probabilities, the odds of correctly identifying the drug concentration on the basis of observed probability of a response in an individual is close to chance for a broad range of response probabilities. Statistical significance is shown by **** p < 0.0001.